Factoids, truthiness and the promulgation of misinformation in the oil sands debate

This morning I opened up my twitter account and the “while you were away” feature had an interesting tweet highlighted. It was from the National Observer which reports itself to be:

“a new publication founded by the Vancouver Observer’s award-winning team of journalists. The National Observer focuses on news through the lens of energy, environment and federal politics.”

The tweet said:

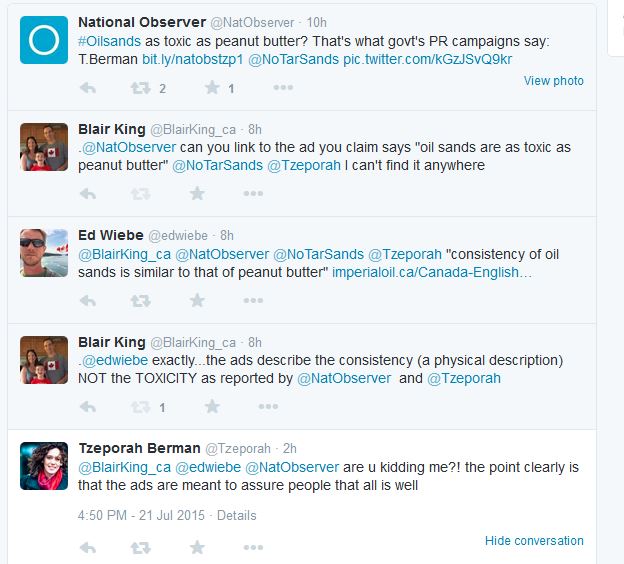
#Oilsands as toxic as peanut butter? That’s what govt’s PR campaigns say: T.Berman http://bit.ly/natobstzp1 @NoTarSands pic.twitter.com/kGzJSvQ9kr

Needless to say I was intrigued: the government was paying a PR company to lie about the toxicity of oil sands, which we all know are very toxic? and so I clicked on the link which brought me to story at the National Observer called: Time for honest talk and messy solutions in the oil sands and authored by a very respected name in the environmental industry: Tzeporah Berman. I have been following Dr. Berman’s career since the 1990’s and when she speaks it carries a lot of weight. Her National Observer blogger page describes her as:

Tzeporah Berman BA, MES, LLD (honoris causa), Adjunct Professor York University Faculty of Environmental Studies is author of This Crazy Time: Living Our Environmental Challenge, Knopf Canada.

The combination of the tweet and the author made me even more interested and so I started reading the story and there was the claim right there in the first paragraph of the story:

The debate over energy, oil sands and pipelines in Canada is at best dysfunctional and at worst a twisted game that is making public relations professionals and consultants on all sides enormous amounts of money. Documents obtained through Freedom of Information routinely show our own government hiding scientific reports, meeting secretly to craft PR strategies and even policy with the companies they are supposed to regulate and millions of dollars are spent on ads trying to convince Canadians that the oil sands are as toxic as peanut butter [emphasis mine] and that without them our hospitals will close.

Unfortunately, the story didn’t contain any references to the source of the claim that “millions of dollars are spent on ads trying to convince Canadians that the oil sands are as toxic as peanut butter“. Now as regular readers of my blog know, I have written a lot about both the topics of toxicology and oil sands so I was very interested in this claim because if an ad campaign has said something of the sort, I would have expected to have noticed it, especially if they spent millions of dollars on the campaign. I did a cursory web search and could find nothing on the topic. So I decided to tweet back to the Observer and asked a quick question:

.@NatObserver can you link to the ad you claim says “oil sands are as toxic as peanut butter” @NoTarSands @Tzeporah I can’t find it anywhere

While waiting I re-read the article and noticed that it was a re-print of a commentary printed in the Toronto Star. So I went to the Star’s web site and found the commentary article titled: It’s time to talk about the oilsands. The article contained an almost identical paragraph:

Documents obtained through Freedom of Information routinely show our own government hiding scientific reports or meeting secretly to craft PR strategies with the companies they are supposed to regulate, while millions of dollars are spent on ads trying to convince Canadians that the oilsands are as toxic as peanut butter[emphasis mine].

Happily the article contained an embedded link to another National Observer story: Harper Conservatives’ secret tactics to protect oil sands: FOI details which contained a lot of links to Freedom of Information (FOI) results. I scanned the released FOI documents and was unable to find the information so I decided to try a different approach. I did a Google search for the words “oil sands” “toxic” and “peanut butter” and was only partially successful. I did find a useful link except it was to a story in The Tyee: Gooey Oil Sands Lies PR Flacks Tell: Call BS! The article described a plan to compare the viscosity of bitumen to peanut butter. The critical line from the story was:

One cheery communication compared the viscosity of bitumen, an ultra heavy crude, to peanut butter [emphasis mine]. Bitumen definitely looks, feels and behaves like asphalt but it sure as hell doesn’t taste like peanut butter.

Using this information, I did another search and found many hits where the viscosity (consistency to the non-chemist) of oil sands and bitumen were compared to peanut butter. Now this made a lot of sense to me. Most people don’t understand what bitumen is like in real life and a PR program to make it sound more friendly by comparing its viscosity and consistency to peanut butter might both allows readers to gain some understanding of the substance and maybe get some positive spin.

The problem with this discovery is that it was utterly harmless and completely inconsistent with the Berman articles. The PR campaign was designed to provide factually correct information: that bitumen has a similar consistency to peanut butter. It certainly did not include any suggestion that they would try and convince the public that oil sands were “as toxic as peanut butter”. Now some of you might call me a bit of a pedant but let’s put this into perspective. We know as a matter of fact that oil sands are very toxic and should not be ingested. If the government was spending “millions” to try and convince us that oil sands were not toxic that would be a fantastically important story. Governments aren’t supposed to lie to the public and when they are caught doing so, they need to be held to account. So a headline saying that the government was spending “millions of dollars” to trying to “convince Canadians that the oilsands are as toxic as peanut butter” which they know is an outright lie, well that would be an important story as well as the first question in Question Period the next day.

My natural impression was that this line represented a simple mistake, a typo, some bad typesetting and so I politely contacted the National Observer which tweeted back the following:

@martynschmoll @BlairKing_ca @edwiebe This is an op-ed and, indeed, the phrase is a metaphor on the first paragraph http://bit.ly/natobstzp1

Now remember this was in the same discussion thread that started with a tweet where the National Observer declared: “#Oilsands as toxic as peanut butter? That’s what govt’s PR campaigns say”. Even if the original use in the story was as a metaphor, the tweet, by the National Observer, was anything but: it was a statement of fact. In this case however, it is equally clear that in the form presented in the Op-Ed it was not presented as a metaphor. I’m not sure how the sentence: “millions of dollars are spent on ads trying to convince Canadians that the oil sands are as toxic as peanut buttercan be read as anything but a statement of fact. A further concern was the fact that a National news service has editors who cannot distinguish between a metaphor and a direct statement of fact? Also there is a second subtext to their tweet. Essentially they are saying that since it is an Op-Ed the article doesn’t have to be factual? I thought news services were supposed to correct errors, not promulgate them.

Having received that disappointing response I tried Dr. Berman. When I contacted Dr. Berman her response was:

@BlairKing_ca @edwiebe @NatObserver are u kidding me?! the point clearly is that the ads are meant to assure people that all is well.

Now remember, Dr. Berman notes on every platform I have been able to locate that she is an “Adjunct Professor York University Faculty of Environmental Studies.” When an academic is shown to have made an error of fact, the typical approach is to quickly correct the error and thank the person who pointed it out, not double-down on the proposition? Dr. Berman may feel that the point of her various articles was to indicate that the “ads were meant to assure people that all is well”, but in the process she made a statement of fact (millions of dollars are spent on ads trying to convince Canadians that the oil sands are as toxic as peanut butter) that cannot be verified with the information provided. Admittedly she may have additional data confirming her statement but she certainly hasn’t presented it for review. As it stands she has made a statement of fact that the government was spending millions on a disinformation program? The documentation I have been able to find suggests that the government spent an undisclosed amount of money providing factually correct information with a government-friendly spin.

I have been asked by a couple people on-line about why I am once again banging on my drum? There is an oft misused term out there: “factoid”. Most people, when asked, think that it refers to a small interesting and (most importantly) true fact but factoid is actually defined as “an invented fact believed to be true because it appears in print”. Another closely related term was coined by Stephen Colbert: truthiness which is defined as “the quality of seeming to be true according to one’s intuition, opinion, or perception without regard to logic, factual evidence, or the like”. In the process of looking up information for this blog posting I found over a dozen different sources already repeating the factoid that millions of dollars are/were spent on ads trying to convince Canadians that the oil sands are as toxic as peanut butter. A few months ago I tracked down a similar piece of misinformation on the attribution of avian deaths to nuclear facilities that had been given time to fester. I wrote about it in a blog post (On estimates of avian deaths attributable to coal and nuclear facilities) where I showed how the data was clearly in error but I was too late, that misinformation now has a life of its own. It shows up in sources as varied as Wikipedia and US World and National Report. Maybe if someone had pointed out the issues with the information on the day it was released that factoid would not be the number one talking point on the topic to this day.

Whether you like our government or not, in this case, they appear to have not done what they are reported to have done. The factoid presented has a ring of truthiness that will appeal to their opponents and, as demonstrated, is already running rampant on the internet. The best way to fight a factoid is with facts. As I wrote earlier, I welcome anyone presenting a document which shows that the government was paying PR people to run a disinformation campaign on this topic, but that is not what I have uncovered in this case. The individuals responsible for promulgating this factoid have a responsibility, if they determine it to be incorrect, to correct the record. I look forward to their doing so shortly.

For those who like the visuals:

Author’s Notes:

2015-07-23 The National Observer has quietly adjusted their text to remove the words “as toxic as” and replace them with the word “like“. Believe it or not, that makes all the difference. The change does little to tone down the article but that minor change addresses all my concerns about spreading misinformation. While the change is not noted anywhere, it represents a great first start. Thank-you Dr. Berman.

2015-07-23: DeSmog blog has now fixed their post and included a correction notice. A great presentation of how a correction should be done to avoid what one commenter calls “zombie evidence”. Great work DeSmog!

Now only the Toronto Star has the incorrect data….

Posted in Oil Sands | 3 Comments

Some pitfalls in the road to an affordable, low-carbon energy future

I was chatting on Twitter yesterday and had another interesting discussion with one of the people with whom I regularly spar. He is a recent convert to environmental activism and, like many of his kin, has a limited science background but a reasonable amount of common sense. He was arguing that I was being obtuse when talking about measures to address the demand side of the supply-demand relationship in energy discussions. The background for this discussion was my Huffington Post blog Energy East Pipeline Fight Is Simply A Proxy War where I pointed out the importance of dealing with the demand for oil and gas in the pipeline debate. As I explained in my Huffington Post piece, and have written at this blog, until we take measures to make carbon-based energy sources more expensive (through a combination of market-based and regulatory instruments) AND address the demand for carbon-based energy sources by providing an affordable alternative, we will not have any chance to reach a carbon-neutral future.

The reason for his complaints was my insistence on talking about renewable energy options when talking about energy demand side of the relationship. You see like many of the activists involved in the debate, he views energy conservation as the primary means to address the demand side of the supply-demand relationship. In my discussions on the topic I continually have to point out that energy efficiency, while an important first step, can only take us so far. No matter how efficient we make our refrigerators, cooling a refrigerator still means using energy. It is at this point that I tend to draw blanks from the other side in my discussions on the topic. The problem is this obvious next step is seldom considered in detail in their confabs. Certainly they are all for looking to convert our energy systems to low-carbon sources but they don’t really stop to think about what that means in a practical sense. They are unrelentingly optimistic that using logic and emotion alone they can convince the world to change to low-carbon energy sources but most fail to recognize that the vast majority of the world looks at price as one of, if not the, deciding factor in energy policy discussions. If the cheapest energy source is carbon-based then, in a lot of the world, carbon-based energy will be the choice that is used.

I have tried to explain that the way to reach carbon-neutrality is to make low/no-carbon energy both less expensive AND as reliable as carbon-based energy. I point out that as Australian politicians have learned, and British politicians are learning, the general public has a limited appetite for do-gooder policies that cost them heavily in the pocket-book and show limited, or non-existent, immediate and readily apparent benefits. In Canada, Conservative operatives are almost literally salivating at the opportunity to create a conflict where the NDP and Liberals are seen to be planning to make energy more expensive and they can play the part of the brave soldiers fighting to “protect the common man” and “save money for working families”.

Now as an aside I am going to address another complaint a number of my detractors have directed my way: the fact that I don’t talk enough about energy efficiency and topics of that ilk. The reality is that the day is only so long and my knowledge-base is necessarily limited (you can’t be an expert at everything and I choose not to try and pretend otherwise). There are many hundreds of more knowledgeable people than me out there making tremendous sense on the topics of energy efficiency. As such I choose not to waste my time trying to replicate their better-informed work. I have chosen to concentrate on the area where I am most knowledgeable and where I feel I can do the most good. This brings me to my personal bugbear: rare earth metals.

As I introduced in my post On renewables and compromises Part II Rare earths in renewable technologies and address in more detail in my post: Deconstructing the 100% Fossil Fuel Free Wind, Water and Sunlight USA paper – Part II What about those pesky rare earth metals? renewable energy technologies are utterly dependent on a handful of rare earth elements (like Neodymium, Dysprosium, Lanthanum) and a few other limiting elements (like Lithium and Platinum). The second of the posts above addresses a paper by Jacobson and Delucchi which includes a breakdown of how rare earths could theoretically be parceled out to allow for the migration to a 100% fossil-fuel free future. The paper, sadly, actually demonstrates the exact opposite to be true. As I wrote in a previous post reviewing that paper:

the production of only 26 million electric vehicles would require 260,000 metric tonnes of Lithium. They [Jacobson and Delucchi] point out that at that consumption level we would exhaust the current world reserves of Lithium in less than 50 years. While 26 million electric vehicles seems like a lot that is only half of the vehicles produced in the world on a yearly basis. Under their 100% WWS USA scenario Jacobson and Delucchi talk about electrifying virtually every mode of land transportation. That would mean a lot more than 260,000 metric tonnes of Lithium a year and that is only for electric vehicles. It completely ignores any other battery (like the Tesla wall units or even rechargeable AA’s) that might be used to help store all that solar energy that is being collected during the daytime but intended for use once the sun goes down.

For the purpose of this post the critical part is the next point:

Jacobson and Delucchi point out that we can always extract Lithium from seawater; but they also point out that seawater extraction is a very energy intensive process. That energy has not been included in any of their energy budgets.

This brings me to the crux of my argument today: the process of either recycling Lithium (or any other rare earth metal) or obtaining that Lithium from seawater will make that Lithium fantastically expensive. Fantastically expensive Lithium cannot be used to make cheap affordable energy. Put another way: you cannot make low-carbon/carbon neutral energy sources more affordable if the raw materials necessary to produce the low-carbon/carbon neutral technologies are ruinously expensive.

Right now the world is relying on China (and some proposed newer facilities in Malaysia and Indonesia) to supply almost all of the rare earth metals used in renewable energy technologies. Those existing and planned facilities are woefully inadequate to supply the quantities of these materials we will need to make a serious dent in our global energy demands. Moreover, the existing facilities are leaving a legacy of environmental degradation in their wake. That legacy will affect the health of tens of thousands of people in Western China (Mongolia) and leave huge swathes of that country uninhabitable for generations to come. To follow this discussion to its obvious conclusion: we cannot affordably produce the number of windmills, solar panels, electric vehicles or battery units we need to replace our coal and natural gas-dependent energy sources without a massive increase in the available Lithium, Platinum, Neodymium, Dysprosium, Lanthanum etc… The only way to obtain these raw materials is a huge investment in rare earth mining and refining capacity in North America and Europe. We shouldn’t just concentrate on the environmental and human health dimension either. We must also consider the geopolitical considerations: right now we are relying on one supplier to keep our renewable energy future moving in the right direction. That one supplier can, and may, change their mind on how they want to proceed. They may decide to redirect those resources internally and we, as the captured customers of this monopoly, have no alternative suppliers or recourse.

Tzeporah Berman, in a piece in the National Observer, talks about the need for some honest talk and messy solutions in our goal to build a new energy infrastructure and reduce oil demand. Well getting our act together and ensuring that we have the raw resources needed to actually develop these low-carbon technologies is one of the necessary first steps in achieving those solutions. Unfortunately, to date, we have ignored this incredibly important first step. Instead politicians and activists are painting us a picture of a world full of electronic vehicles and windmills but none acknowledge that we lack the basic resources to make their picture a reality. We need to invest in the facilities to avoid these foreseeable bottlenecks in our supply of rare earth metals and critical elements. At the same time we must invest in research to allow us to eliminate or get around those bottlenecks in the first place. Until we actually take some action on this incredibly important topic we are metaphorically wandering aimlessly down a dark road oblivious to the pitfalls on our route.

Posted in Leap Manifesto, Renewable Energy | 1 Comment

The Machiavellian battle against climate change using Energy East

As many of my regular readers have probably noticed, I have been asked to produce the occasional blog post at the Canadian edition of the Huffington Post. My most recent post deals with the Energy East Pipeline (Energy East Pipeline Fight is Simply a Proxy War), a topic most of my readers know well as I have covered it thoroughly in previous posts including The Energy East Pipeline: Dispelling Some Myths and Where the new Pembina Report misses the mark on Energy East. The one downside of a blog at the Huffington Post is that there are some restrictions, I have to write for a general audience (so my more technical treatises are out) and there is a strict word count (so my technical treatises are out J). Thankfully I still have this venue to provide deeper insights into the topics I cover elsewhere. Today’s deeper insight has to do with what I have coined: the Machiavellian battle against climate change using pipelines.

As I write in my Huffington Post piece, the current war against the Energy East pipeline is nothing but a proxy battle. As I describe briefly in that post, and in much more detail in my two other posts referenced above, the presence or absence of Energy East will have virtually no effect on whether the currently active and mostly finished oil sands projects will continue to operate. As I pointed out previously in my post on the economic and environmental folly of trying to “strangle the oil sandsand as Dr. Andrew Leach points out in Maclean’s, these facilities represent a sunk cost to the operators and they aren’t about to throw that money away. Most of these plants were originally envisioned in a time when oil prices hovered in the $35 /barrel (bbl) to $45/bbl range. They were profitable then and would therefore remain profitable in the $50/bbl to $62/bbl range we have witnessed for the last couple months. Those plants were also built in an environment where pipelines were not an assumption but simply a hope. As such alternative arrangements were made to ensure that the oil would make it to market. This mostly consisted in heavy investment in rail terminals and in rolling stock (oil cars). As I have pointed out previously in my post on the economic and environmental folly of trying to “strangle the oil sands” the capacity is already in place south of the border and we have more than enough capacity north of the border to meet the oil sands needs by rail. Heck even the savviest investor in the world Warren Buffet has major holdings in the construction and leasing of oil cars for the railway system. As I have written more times than I would care to admit, transporting oil by rail is much riskier, both in terms of human health and ecological health, than moving the same volume via a pipeline. Notwithstanding the recent spate of spills (including yesterday’s Nexen spill) transporting oil by pipeline is the safest most environmentally sensitive way to get oil to market.

The primary aim of this post, however, isn’t to rehash these old arguments. Rather it is to address the nature of the people who are fighting the battle against the pipeline. The inspiration for this post was an entirely different post on a totally different topic. It is one of the best posts I have read this year on any topic and was penned by William Saletan and titled “Unhealthy Fixation: The war against genetically modified organisms is full of fear mongering, errors, and fraud. Labeling them will not make you safer.” If you want to read a devastating critique of the tools used by activists and fear mongers in their battles (in this case against GMOs) there is not a better piece to read this year. It is very long, but the reason for the length is that he shows again and again how Machiavellian the activists can be. They don’t restrict themselves to the truth, they change their stories on a dime and they demonstrate a resounding lack of the moral and intellectual underpinnings the rest of us consider a requirement in order to operate in civilized society.

Why this has struck so close to home is a series of admissions I have received from various folks on my social media feeds. In response to my Huffington Post piece a number of people have written me to point out various forms of the same message that: yes, the battle against Energy East is indeed a proxy war against climate change. Climate change activists are targeting pipelines to keep the conversation about climate change going. They are using pipelines because they have been unable to make a compelling enough case for action on climate change on its merits. They view the Energy East pipeline as a “lever” that they can use to force change because the tools really needed to fight climate change (market based instruments) are a much harder fight to win. I have been told that “pipelines serve as an effective, visible touchstone”. When I have pointed out that shutting down the pipeline will only force more oil to be transported by rail I was met with the point that rail cars are visible while oil moving in a pipeline is not. When I pointed out that the oil trains pose a greater risk to human health and the environment I got the distressing response that

“these tactics effectively apply pressure to reassess the fossil fuelled system as a whole, i.e. we’ll see what happens to any remaining social license when oil trains start blowing up left, right and centre”.

Yes I am as shocked about that statement as you are. In two sentences it is acknowledged that they know that by fighting the pipelines they guarantee that there will be more spills and that they are essentially counting on those spills, and their ensuing ecological devastation and potential for loss of human lives, to degrade the social license of the oil industry. Metaphorically it is like they are holding up a grandma and a newborn kitten and saying “give us what we want or these two won’t like it”. I honestly had no clue how to respond.

In politics they have what is called a Kinsley gaffe. It is defined as “when a politician inadvertently says something publicly that they privately believe is true, but would ordinarily not say because it is politically damaging“. Well this was a classic Kinsley gaffe, it told me outright what I have feared was true from the beginning. These activists have an evangelical fervor for their mission and they don’t care who gets hurt in order for them to achieve their goals. It is not just with pipelines though, you see the same thing in the fracking debate. It leaves me in a quandary. As I have written many times, I am a Pragmatic Environmentalist, I want to see our global conditions getting better. As I wrote in 1995 we need good cops and bad cops to advance the cause. I always understood the concept of noble cause corruption but did not suspect at the time that these good people I worked and studied with could become the sort of people who secretly hoped that bad things would happen to good people in order to advance their cause. I am saddened by my newfound revelation. That doesn’t mean I’m going to stop moving forward in my goals, but it does mean I am going to look a second time at the folks I used to think of as potential allies. The critical feature of the “good cop, bad cop” scenario is that both individuals were still “cops” and were thus restricted to legal and ethical means to achieve their goals. I can’t guarantee that is the case with today’s activists.

Author’s Note: I have received some negative feedback about this post from various environmental activists. I want to be clear that I, personally, believe that the vast majority of grass roots activists I have encountered are entirely honest in their beliefs. Their opinions, while often ill-informed, are honestly held. My disdain at the end of this post was for that cadre of professional activists who have grown to see “environmentalism” as a day-job and depend on continuing conflict for their fundraising campaigns and their paychecks. These people, like the GMO opponents described by Mr. Saletan, do not do justice to the cause they profess to support.

Posted in Climate Change, Energy East, Pipelines | 16 Comments

More thoughts on Aquifers, Shills and the Commoditization of Groundwater

Late last week I posted my thoughts on Aquifers, Drought and the Nestlé water bottling plant in Hope and the response has been overwhelming. My Twitter and Facebook feeds exploded and I was even interviewed by a local radio station CKNW (a recording of the interview is provided here) on the topic. As part of the furor I received a lot of interesting information and was the target of a lot of misinformation, the most prominent of which I will address in this blog post:

Conflicts of Interest:

Let’s start with the easiest one first. I am not in the pay of Nestlé, no one in my family earns any income of any sort from Nestlé and I have received absolutely no compensation for my post or my media appearance. The suggestion that I am a “shill” or “in the pay of Nestlé” is an expected response to my blog postings. So expected that I have previously addressed the “shill gambit” in a post titled “On “Bullies”, “shills” and using labels to shut down legitimate debate”. My graduate research was on the use of scientific data in environmental decision-making and while I currently work in the field of contaminated sites I retain a personal interest in my earlier field of research. When I see an environmental debate being overwhelmed by bad or incomplete data I have a tendency to step in. This case meets that bill admirably.

More on Aquifers:

The biggest bit of misinformation I have had repeated back to me again and again is how the use of water in Hope will somehow effect the rest of us or future generations. In my earlier introduction to aquifers I pointed out that aquifers come in two major types: confined and unconfined aquifers. A confined aquifer is water trapped in permeable rock or porous materials (like gravels and sands) that is confined on both the top and the bottom by an impermeable layer (typically either bedrock or very tight layers of silts and clays). Confined aquifers are typically under pressure (generally artesian in nature) and are sometimes referred to as “fossil waters” as they typically represent waters that have taken generations to build up and once depleted can take generations to replenish. The use of these fossil waters is an ongoing concern and has led to tremendous changes in groundwater conditions in much of the Southern U.S. The use of these fossil waters must be monitored in the same way that other non-renewable resources must be monitored because once extracted these waters will not be readily replaced in our lifetimes. Unconfined aquifers on the other hand are made up of similar porous materials but are not confined vertically. They are in contact with the surface via the unsaturated zone which goes up to the ground surface. The groundwater surface in an unconfined aquifer is often called a water table and the water table can rise and fall depending on how much water is added via precipitation, or the migration from surface water bodies, and how much is drawn off by humans or runs off, also via surface water bodies like lakes , rivers and streams.

The Lower Mainland is dominated by unconfined aquifers which are used by the inhabitants of the Fraser Valley including much of Langley, Abbotsford, Chilliwack and Hope. The important thing to understand about these aquifers is that they are mostly hydraulically isolated from each other. You can think of these aquifers like a bunch of underground swimming pools full of sand/gravel. Take the water from one and you don’t affect its neighbours. Each aquifer has its own source (a watershed) and must be treated as an individual entity. The aquifer used by Nestlé is a particular type that is hydraulically connected both to a watershed and to a lake: Kawkawa Lake. This is important because unlike many aquifers in the region, as water is drawn from the Kawkawa aquifer (by Nestlé) the aquifer is refreshed by the Lake, and the corresponding watershed. Thus the condition of the aquifer can be inferred by the conditions in the Lake. As long as the Lake level remains relatively stable the aquifer can also be inferred to be relatively stable. The Kawkawa aquifer drains to the Fraser River via Sucker Creek and then the Coquihalla River. As long as Sucker Creek continues to flow then we know that the aquifer is not only doing well but has an excess of water. As I noted in my previous post, the amount of water extracted by Nestlé is equivalent to about 72 seconds worth of water flow from the Fraser River as it passes Hope. I cannot emphasize this enough: the operation of the Nestlé plant in Hope no way affects the larger water supply of the Fraser Valley or the even larger water supply of the Lower Mainland. If Nestlé stopped operating (and put its 75 employees out of work and stopped paying municipal taxes) would there be more water for the rest of us? Absolutely not. Kawkawa Lake drains its excess water into the Fraser River, which simply drains into the Strait of Georgia. Neither the Fraser River at Hope nor the Strait of Georgia are particularly short of water even in the driest of years.

The Water Sustainability Act:

As I mentioned briefly, the BC government is in the process of modernizing its regulatory environment for groundwater and the centerpiece of this process is the Water Sustainability Act which is intended to provide an improved and modernized regulatory control over our groundwater resources. The government has been in the process of rolling out the Act and its associated regulations and has been engaging stakeholders on a variety of topics. One of the big topics has been on water pricing. The emphasis of the water pricing regime continues to be on a user-pay principal where the water users pay for the management of the regulatory regime only. My understanding is that the intention is not to turn a profit but to pay for the process of regulating groundwater and ultimately for mapping and tracking our groundwater resource use. As I have written, tweeted and said on radio, the first step in regulating a resource is to understand its extent and capacity. Historically we as British Columbians have done a poor job at monitoring the use of our groundwater and the fact that the government is now taking the step of filling in our data gaps on the issue is a cause for congratulations and not condemnation. To my understanding British Columbia is leading the country in this regard and perhaps the naysayers should do a bit more research before going all partisan on this important non-partisan pursuit.

Commoditization of Groundwater:

The biggest complaint amongst both my friends and my detractors has been on the pricing of water. As I describe above, the government is talking to stakeholders about this topic but there is an important point that the purveyors of that petition demanding that “BC Charge a fair rate for the use of groundwater”. Ironically, the purveyors of the petition might end up getting exactly the opposite of what they want by charging for groundwater. Under the current regulatory regime, groundwater is not treated as a commodity. All users access groundwater for free. As I describe above, the planned pricing is for regulatory purposes and not for profits. As described by Judi Tyabji (and provided to me by Randy Rinaldo @RanRinBC) on her Facebook Page, the biggest protection our groundwater has in a North America dominated by the North American Free Trade Agreement (NAFTA) is the fact that we have not treated groundwater as a commodity. To the best of my knowledge, once you turn groundwater into a commodity you put it under NAFTA and instead of it being regulated by the government of British Columbia, it gets regulated under NAFTA. That means that foreign governments and businesses can sue to get control over access to these groundwater resources and can demand a payout if they are denied access. Right now the government can still regulate the use of groundwater. If we turn groundwater into a commodity by pricing it competitively we run the risk of losing that ability. They say that the road to hell is paved with good intentions. Wouldn’t it be ironic if by signing that petition the petitioners actually managed to force control of our provincial resources to a foreign dominated trade commission or tribunal?

Author’s note: some people have disagreed with my interpretation of NAFTA but none have yet explained a technical basis for their disagreement. I welcome any opportunity to learn more about the topic and would welcome any corrections in the comments.

Posted in Uncategorized | 16 Comments

On Aquifers, Drought and the Nestlé water bottling plant in Hope

Today’s topic comes to us courtesy of my local newscast. As many of my readers know, much of the Pacific Northwest (including parts of British Columbia) is under drought. As a consequence of the drought-like conditions we have been put on Level II water restrictions, which for non-British Columbians means you can’t do a lot of everyday things like watering your lawn (except under strict conditions). A feature of these restrictions is a limitation on the industrial use of water. As an example, the restrictions mean that many power washing companies that depend on Metro Vancouver water are not allowed to operate; leaving a lot of people out of work. This evening our local news featured a story about Nestlé Waters Canada (Nestlé) and its water bottling plant in Hope B.C. (Nestle faces renewed criticism of their B.C. groundwater operations as drought levels increase). After watching that broadcast I figured I should post a blog to help people understand about aquifers and explain why the Nestlé bottling plant may not be the bad guy portrayed in the local news.

There are a lot of misconceptions about aquifers, groundwater and our potable water supply; so to begin I am going to provide a mini-primer on aquifers. As described by Environment Canada:

An aquifer is an underground formation of permeable rock or loose material which can produce useful quantities of water when tapped by a well. Aquifers come in all sizes and their origin and composition is varied. They may be small, only a few hectares in area, or very large, underlying thousands of square kilometres of the earth’s surface. They may be only a few metres thick, or they may measure hundreds of metres from top to bottom.

There are two major types of aquifers: confined and unconfined. As described by the US Geological Service:

A confined aquifer is an aquifer below the land surface that is saturated with water. Layers of impermeable material are both above and below the aquifer, causing it to be under pressure so that when the aquifer is penetrated by a well, the water will rise above the top of the aquifer. A water-table, or unconfined, aquifer is an aquifer whose upper water surface (water table) is at atmospheric pressure, and thus is able to rise and fall. Water-table aquifers are usually closer to the Earth’s surface than confined aquifers are, and as such are impacted by drought conditions sooner than confined aquifers.

In an unconfined aquifer the

level below which all the spaces are filled with water is called the water table. Above the water table lies the unsaturated zone. Here the spaces in the rock and soil contain both air and water. Water in this zone is called soil moisture. The entire region below the water table is called the saturated zone, and water in this saturated zone is called groundwater (ref).

Note: for those of you who went to school in the 1990s (or before) you would have used the term “vadose zone” rather than the more modern term “unsaturated zone”.

An unconfined aquifer can be refreshed by a number of means. The most obvious is via rainfall. Rain that hits a permeable surface can percolate through the soils of the unsaturated zone eventually ending up as groundwater. If input exceeds output then the water table rises. If drawdown exceeds the input then the aquifer surface (water table) will drop. Unconfined aquifers often also live in harmony with surface water bodies. Streams that run over an unconfined aquifer can refresh the aquifer when it is low and can be sourced by the aquifer when the water table is higher. Similarly, an aquifer can be fed by a bigger water body like a lake. In that case the lake can serve as a reservoir for the aquifer, allowing users to draw groundwater with the aquifer being refreshed by the lake water. Using the terminology the aquifer is hydraulically connected to the lake. As long as the lake is there the aquifer will remain at a relatively steady state.

In the lower mainland the groundwater supply is dominated by unconfined aquifers. In my local community (the Township of Langley) we have a hybrid water system:

The Township is one of the few municipalities in the Lower Mainland that relies heavily on groundwater, for agricultural, commercial, industrial and residential uses; 23% of the Township is not supplied by the municipal drinking water system, and residents in these areas rely on private wells. However, the majority of the Township’s population live in areas served by one of two municipal water systems. The smaller eastern system is entirely groundwater based, while the larger western system supports 61% of the Township’s total population, and is a mix of groundwater (40%) and Greater Vancouver Regional District (GVRD) [now called Metro Vancouver] surface water (60%). The Township prefers to use its own available groundwater, as it is significantly cheaper than purchasing surface water from the GVRD. The Township of Langley operates 18 municipal wells, and private wells number at least 5,000 (ref).

I live in a part of the community supplied with GVRD water which is sourced from reservoirs north of the Fraser River. The Capilano and Seymour Watersheds in the north shore mountains, and Coquitlam Watershed in Coquitlam each feed reservoirs which serve as our water source (ref). These reservoirs are fed by watersheds whose water is sourced by a combination of precipitation and snowfall runoff. Since these reservoirs are finite, once the snow has all melted any water taken from them during the dry season is not returned and the reservoir levels start to drop. After a winter with an unusually low snow pack and a particularly dry spring the water levels in our three local reservoirs are already dropping precipitously which is starting to cause water managers to be concerned. This explains the water restrictions in my part of town.

My father-in-law lives in the community of Aldergrove, in the southeast corner of the Township. His water comes from a groundwater-based system using a number of municipal wells that draw from a number of smaller unconfined aquifers including the Aldergrove and Abbotsford Aquifers (ref). These aquifers (along with the Hopington Aquifer) represent some of our region’s most threatened groundwater resources. The problem is that these aquifers are used by the community of Aldergrove, by residences in the agricultural lands, by agricultural users and are also important sources for a number of very important salmon streams. For those of you unfamiliar with the area, almost 75% of the Township of Langley is in the Agricultural Land Reserve (ALR) and agricultural users, in the ALR, are given priority in water use battles. The increasing and sustained use of these smaller unconfined aquifers is having a negative effect as drawdown in summer has continuously exceeded the inflow in winter. As such a number of these unconfined aquifers are threatened and thus the Township developed a Water Management Plan. As part of that plan the Township is spending a good deal of money to hook Aldergrove up to the Metro Vancouver water supply to reduce the stress on the aquifers, but until then water restrictions are even heavier in that part of the community. Even in non-drought years come summer my father-in-law is not even allowed to wash his car by hand…a true hardship according to him.

So how does this all relate to Nestlé way up in Hope? Well like us the District of Hope is under water Stage IV water restrictions which even limits the hand watering of lawns (ref). As such you might think that Nestlé should be limiting its water use? But it isn’t that simple. The District of Hope gets its water from a number of sources only one of which is the KawKawa Lake sub-watershed (the aquifer shared by Nestlé) and thanks to the large watersheds areas and low population densities in most of these aquifers drawdown is not significantly exceeding inputs. As indicated at the District of Hope web site:

Although water supplies appear to be abundant, the costs associated with the delivery of water to your residence weighs heavily on our infrastructure system. By reducing the demand for water the District of Hope will reduce costs and extend the life of our pumps that pull the water out of the ground providing you with fresh consumable drinking water. Water conservation is our number one priority to ensure ample water not only for today’s customers but for generations of customers to come (ref).

As for Nestlé, in 2012, corporate affairs spokesperson John Challinor said, Nestlé withdrew 71 million gallons (ref) in its operation. Now that sounds like a lot until you put that number into perspective. Regular readers of my blog will remember my post How Big and Small Numbers Influence Science Communication: Understanding Fuel Spill Volumes where I discussed the “Olympic-sized swimming pool” as a measure of volumes used to scare people about oil spills. Well 71 million gallons translates to approximately 268 million litres of water which is just under 108 Olympic-sized swimming pools (OSPs).

The Kawkawa watershed system, upon which the aquifer used by Nestlé draws, includes Kawkawa Lake which is approximately 1 km long by 1 km wide (ref). That represents 1 billion litres of water for each meter of depth in the lake and that is only the stationary storage since the lake draws from a watershed that is many square kilometers in area. As I described above, when an unconfined aquifer is hydraulically connected to a surface water body (KawKawa Lake in this case) then the aquifer would only be at risk if the Lake were at risk, but as pointed out in the Tyee article Nestlé draws less than 7/10th of one percent of the available water in the sub-watershed. That is a rounding error even in the driest of years. As described in their documentation, Nestlé has been operating for 15 years at this location and they have seen no effects on Kawkawa Lake. Rather excess water from the lake continues to flow into Sucker Creek and from that into the Coquihalla River and ultimately the Fraser River. To put this volume into perspective, the Fraser River has an average flow rate of 3.745 million liters of water per second (ref) so the amount of water extracted by Nestlé in a year is about 72 seconds worth of water flow from the Fraser River as it passes Hope. So to answer the question, does the Nestlé operation put the aquifer at risk? Absolutely not. If Nestlé stopped operating (and put its 75 employees out of work and stopped paying municipal taxes) would there be more water for the rest of us? Absolutely not. Kawkawa Lake drains its excess water into the Fraser River, which simply drains into the Strait of Georgia. Neither the Fraser River at Hope nor the Strait of Georgia are particularly short of water even in the driest of years.

To be clear here, I am not saying that Nestlé shouldn’t be paying more to extract groundwater from the aquifer, but that is a matter for our elected government to decide. What I am saying is that the operation of the Nestlé plant in Hope would not appear to be affecting the local water supply in Hope, the greater water supply of the Fraser Valley or the even greater water supply of the Lower Mainland. Nestlé’s water supply is completely independent of the water supply used by you and me in Metro Vancouver and not a single litre of the water bottled in Hope would otherwise be available to the users in Vancouver dependent on the Metro Vancouver Water system. The only reason to deprive those 75 people of their employment and the District of Hope of those tax revenues, during this drought, is to make someone else suffer in order to make ourselves feel better and that is not a very reasonable basis for a policy decision.

Posted in Uncategorized | 17 Comments

On RCP8.5 and "the Business as Usual" Scenario – Different beasts not to be confused

This weekend I finally got the opportunity to read Dr. Matt Ridley’s recent essay “The Climate War’s Damage to Science” in the Quadrant Online. As a fellow Lukewarmer I try to keep abreast of Dr. Ridley’s essays and articles and am seldom disappointed by his prose. This article, like most of his work, made for a very interesting read and I would recommend it to anyone interested in the topic of climate change politics. While reading the essay one particular paragraph jumped out at me. The paragraph described one of the Representative Concentration Pathways (RCPs) used in the IPCC Fifth Assessment Report. In the essay Dr. Ridley wrote:

What is more, in the small print describing the assumptions of the “representative concentration pathways”, it admits that the top of the range will only be reached if sensitivity to carbon dioxide is high (which is doubtful); if world population growth re-accelerates (which is unlikely); if carbon dioxide absorption by the oceans slows down (which is improbable); and if the world economy goes in a very odd direction, giving up gas but increasing coal use tenfold (which is implausible).

This paragraph reminded me that I had previously committed to writing about the IPCC RCPs and in particular about RCP8.5 which is often referred to, incorrectly, as the “Business as Usual Scenario”. The reason for my interest in this rather anodyne topic is that it actually represents a quite excellent example of how science is misrepresented to the public in the climate change debate.

As I describe in my post “Does the climate change debate need a reset? – on name calling in the climate change debate” one of the critical battles in any debate is control over the labelling of the actors. If you can apply the best possible label to yourself and the least agreeable label to your opponent you immediately gain the upper hand. In the climate change debate, the “Business as Usual” label has been used more times that I can count with activists from the folks at Skeptical Science to the Suzuki Foundation, and from the Pembina Institute to 350.org all finding some way to slip that phrase into their calls demanding immediate action (and of course donations to their cause). As this post will demonstrate, however, the “Business as Usual” descriptor used by the activists in the climate debate is nothing of the sort. Rather it is an artifact from earlier versions of the IPCC reports and was conspicuous by its absence in the most recent (Fifth Assessment) report.

Let’s start with some background. As anyone who has read my writing knows one of the ways to make science more reader-friendly is to use analogies and personal anecdotes. Of course the risk with analogies is that a bad analogy can distract from your narrative. Similarly, anecdotes can personalize your writing and make it more approachable but anecdotes are only valuable if they are subsequently supported by actual data since the old saw goes “the plural of anecdote is not data”. In this vein, the earliest IPCC reports used “Scenarios” to inform their modelling exercises. As they put it:

Scenarios are images of the future, or alternative futures. They are neither predictions nor forecasts. Rather, each scenario is one alternative image of how the future might unfold. A set of scenarios assists in the understanding of possible future developments of complex systems. Some systems, those that are well understood and for which complete information is available, can be modeled with some certainty, as is frequently the case in the physical sciences, and their future states predicted. However, many physical and social systems are poorly understood, and information on the relevant variables is so incomplete that they can be appreciated only through intuition and are best communicated by images and stories. Prediction is not possible in such cases (ref).

I have neither the time nor the expertise to discuss the scenarios is a manner worthy of them and so will leave that to Dr. John Nielsen-Gammon from Texas A&M University who has prepared a brief breakdown on the history of the different scenarios used by the IPCC (ref). He also describes the process by which the most recent IPCC Report eliminated these scenarios. The reason for this is simple, by 2014, the older scenarios had outlived their usefulness. The public was no longer in need of spoon-feeding and instead the RCPs were rolled out. Four RCPs were generated for the Fifth Assessment report representing four different forcing pathways. A simplified definition of a “forcing” is the difference between the energy from the sun absorbed by the earth and that radiated out into space (ref). The four RCPs were labeled by the approximate radiative forcing (in watts per meters squared) expected to be reached by following the respective pathways during or near the end of the 21st century. The four pathways are RCP2.6, RCP4.5, RCP6.0, RCP8.5 (ref). The roles of the RCPs, therefore, were not to inform the public as much as to inform the modellers in the IPCC process. Specifically, they were intended to drive the climate model simulations that formed the basis of many of the future projections in the most recent IPCC report (ref). To put it another way, RCP8.5 was a pathway designed to model a set of conditions that could lead to a world where climate forcing by the year 2100 reached 8.5 watts per meter squared. It was essentially designed to provide a worst-case scenario [used in its traditional literary sense] if everything in the world went sideways or backwards (as I will detail later).

The problem with the IPCC retiring its old scenarios is that a lot of activists were very happy with the old paradigm and had no desire to change their tunes. They wanted something that they could sink their teeth into and use to scare the public and politicians. Since the IPCC had taken away their well-established tools they appear to have decided to re-label one of the new tools to suit their purposes. So they affixed the retired “Business as Usual” scenario label (some use the term “status quo”) to RCP8.5 and continued on their merry way scaring up new funding. The only problem is that, by definition, RCP8.5 was not a “Business as Usual” scenario, rather it was

developed to represent a high-end emissions scenario. “Compared to the scenario literature RCP8.5 depicts thus a relatively conservative business as usual case with low income, high population and high energy demand due to only modest improvements in energy intensity.” (Riahi et al. 2011 ref) RCP8.5 comes in around the 90th percentile of published business-as-usual (or equivalently, baseline) scenarios, so it is higher than most business-as-usual scenarios. (van Vuuren et al. 2011a ref)) – (Text ref)

What the activists call: “Business as Usual” actually represents the 90thpercentile of the scenarios prepared for the IPCC that involved little change in environmental and economic policies (sometimes referred colloquially as the “no significant action” scenarios). These scenarios represented the worst of the worst where governments and industry did not do anything to improve their lot. As such the no significant action scenarios could only be described as “business as normal” if you happened to be living in 1990 or 1996 when the IPCC prepared its original couple reports. That would be before we had spent 20 or so years learning about climate change; before the Kyoto Protocol and the world-wide drive to renewable energy; before the discovery of tight shale gas and the move away from coal as the primary source of future energy plants in much of North America, Europe and Asia. To put it simply, being at the 90thpercentile of that group put you in pretty impressive company and does not relate to anything that anyone in the real world would actually expects to happen. Rather, in a relative sense as the 90thpercentile of all those earlier estimates, it would be the scenario that comes just below the scenario where Godzilla emerges from the sea to burn Tokyo and the scenario where the atmosphere spontaneously combusts from the endless bursts of Hiroshima-bomb-powered forcings.

I have made a pretty bold statement that RCP8.5 is not really relevant in a real-world sense and I suppose it is time to back that up with data. In order to understand how RCP8.5 has already been trumped by history you need to look at the history and contents of RCP8.5. Readers interested in the details should read the paper by Riahi (et. al. 2011 ref). Dr. Riahi is one of the authors of the original IPCC Scenarios upon which RCP8.5 was based in 2007 (ref). At that time, consistent with the education theme each IPCC Scenario had a “Storyline”. The storyline described the assumptions of the scenario in easy to understand language. The “Storyline” for RCP8.5 originates from Scenario A2 in the Third IPCC Report but was further refined in Riahi (et. al. 2007 ref) as A2r. As recounted in the Third IPCC Report (and detailed in these references (ref ref and ref) the A2 storyline was characterized by:

  • lower trade flows, relatively slow capital stock turnover, and slower technological change;
  • less international cooperation than the A1 or B1 worlds. People, ideas, and capital are less mobile so that technology diffuses more slowly than in the other scenario families;
  • international disparities in productivity, and hence income per capita, are largely maintained or increased in absolute terms;
  • development of renewable energy technologies are delayed and are not shared widely between trade blocs;
  • delayed land use improvements for agriculture resulting in increased pollution and increased negative land use emissions until very late in the scenario (close to 2100);
  • a rebound in human population demographics resulting in human population of 15 billion in 2100; and
  • a 10 fold increase in the use of coal as a power source and a move away from natural gas as an energy source.

Looking at what the activists have labelled the “Business as Usual” scenario we see a slew of assumptions that are anything but business as usual. It is generally accepted in the demographic circles that the human population will max out at between 10 and 12 billion (ref) so the population estimate is off by around 25%. Rather than trade blocs hoarding technologies we are living in an increasingly international world where technological improvements move at the speed of the internet and new and improved renewable energy technologies are both being developed and shared worldwide. Coal use is decreasing as a percentage of our energy supply and the shale revolution and access to cheap and plentiful natural gas has resulted in an international market for liquefied natural gas and increases in energy intensities not decreases. To put it bluntly, virtually every one of the assumptions of the RCP8.5 have been demonstrated to be categorically wrong. No surprises here, when the IPCC picked a worst case scenario they went full bore on that approach.

I see I am running long so let’s summarize this post. When you see an abstract where the authors say something like:

We show that although the global mean number of days above freezing will increase by up to 7% by 2100 under “business as usual” (representative concentration pathway [RCP] 8.5), suitable growing days will actually decrease globally by up to 11%…. tropical areas could lose up to 200 suitable plant growing days per year….Human populations will also be affected, with up to ~2,100 million of the poorest people in the world (~30% of the world’s population) highly vulnerable to changes in the supply of plant-related goods and services (ref).

It is time to gently close the journal and back away slowly so as to not attract the author’s attention. By basing their study on RCP8.5 and specifically referring to it as the “business as usual” scenario the authors have told you all you need to know about the reliability of their paper. Similarly when an activist talks about “business as usual” in their sales pitch, it is time to put your wallet back in your pocket. If you are so inclined then it is it is time for you to find a group that is more serious about improving our planet and more in keeping with what the IPCC actually has to say. RCP8.5 is not a business as usual scenario but rather a future scenario that has been soundly invalidated by the conditions in the present.

Posted in Climate Change | 7 Comments

So do you really need an $8000 water treatment system in Langley?

I figure it is time for a change of pace post on this blog. For the last little while I have gotten into some relatively heavy technical stuff that has scared some of my most faithful readers (including my mom) away. Today I am going to discuss something that is much more approachable and applicable to our daily lives in a post about water quality. The idea for this post comes from an unexpected visit I had this week from a salesman for a water treatment system company. The visit started with mis-direction, was filled with mis-information and ended with me realizing how easy it is for someone using the right combination of words to scare families into buying an expensive system they simply do not need.

The visit was preceded by an official sounding telephone call. Months ago my wife got a telephone call from someone purporting to be associated with the Township (we live in the Township of Langley) who asked her a bunch of questions about our water. Tuesday night we got a follow-up call from a woman who said she was following up on the survey. She talked to my wife and made it sound as if the Township had hired their company to come out and sample our tap water. There was no indication that this was a sales call but rather she made it sound like we were being asked to do our civic duty by allowing their professional to come into our house to do some testing. Since it was a rare night when we didn’t have any children’s sports scheduled, and I was going to be home, my wife suggested that they come that night and we scheduled a time. At the end of the phone call my wife was asked our occupations (purportedly for demographic purposes), she said she was a teacher and I was a Chemist. Now any sensible company would have had red flags flying upon hearing my profession (like the lawyer in the jury pool who gets tossed without any other consideration) but maybe the woman thought I was a pharmacist so who knows.

At the scheduled time a gentleman arrived at our door. He was soft-spoken and wearing a pair of khakis, looking every bit the part of an environmental technician (and I should know) with a clamshell briefcase full of supplies. He gave me a card with his company’s name (for the purpose of this blog I am not going to use the company or tester’s name as the point is not this person in particular but the approach in general) and we welcomed him in. The card indicated that the company was a “Gold Seal Approved – Canadian Water Quality Association Member” which sounded sufficiently official to belay our concerns. He efficiently set up his testing station and cleaned his supplies with a bottle of water marked as “reverse-osmosis water” (ROW) all the time chatting about water. I moved back to give him space (I didn’t want to interfere with his testing) and instead he invited my wife and I forward. First he pulled out a hand-held total dissolved solids (TDS) meter. A TDS meter measures the level of TDS in your water and is a pretty straightforward tool. He first measured his ROW water and got a reading of 4 parts per million (ppm) which is a very low reading consistent with a distilled/RO water. He then measured our tap water and got readings a reading of 14 ppm, he then re-filled the water and got a 21 ppm and started tut-tutting. At this point I started to tweak into the fact that this was not a Township water test as he didn’t have a notebook and wasn’t recording anything anywhere. Now as a Chemist who used to do this type of testing for a living (I now have technicians who do my testing for me) I can say TDS values from 14 to 21 from our tap is absolutely tremendous number. The Canadian Drinking Water Guidelines are 500 ppm (ref) and at 21 ppm I am almost ready to retire my Brita. The tester however was quite concerned and pointed out how our value was “elevated” I almost chocked when he used the word “high” at one point. He pointed out that the water system he uses can get your number down to single digits (as low as 1) which he made sound pretty significant. At this point I smiled to my wife as we knew this was no water test and we got ready for the sales pitch.

The next test was the addition of a single drop of “Agent #5” (I admit I might have the number wrong) which turned the water purple. Our water was darker purple which he informed us was a bad thing. He then cleaned his glassware and re-filled the two beakers (one with his water one with ours) and added two drops of our dish soap. He shook the two beakers vigorously and lo-and-behold his had more suds. He added two more drops of our soap to our water and shook it and the suds were still not as fluffy. He attributed this to the TDS in the water. In this he was almost right in that one benefit of reverse osmosis is that it softens water a tiny bit and anyone who has dealt with water softeners knows, the softer your water the better your soap bubbles. That being said, if your water is too soft it can seem almost impossible to wash the suds off your body. So now we have had three tests none showing anything slightly wrong with our water. He then moved to our soap pointing out that our dish soap was not organic and likely had sulfonic acids in it. How he knew is an interesting question as our dish soap is from a container without any labels, but even then sulfonic acids are a feature of detergents that are completely unspectacular. Soaps need surfactants to deal with oils and it is just one of many alternatives. It is like being made to fear your vinegar because it has acetic acid in it…for the non-chemist vinegar is simply a mix of acetic acid and water. He then informed me that the chlorine in municipal water mixes with sulfonic acid to make mustard gas, which of course, is chemically impossible.

His next line of discussion was the chlorine in our municipal water and how this chlorine can make people sick. He pointed out that when we shower we are exposed to chlorine gas. This is a common ploy and one that while chemically true is completely deceiving. I discussed the concept in detail in an earlier post: Risk Assessment Methodologies Part 2: Understanding de minimis risk how minimal concentrations of compounds are essentially ignored by your body. Except in exceptional cases, like when the municipality is flushing the lines with chlorine (which they announce in the papers), the amount of chlorine gas in your shower would not harm a fly, let alone a human. At this point it was clear to him he was losing us. I kept turning and smiling to my wife when he said something chemically impossible/improbable so he cut to the chase and informed us that he was a representative of a water treatment company and provided us with a quotation for a system at our water intake and a second system by our kitchen sink, total cost only $8000 and as a bonus they would supply us with all the soap (organic soap he said) for 5 to 7 years….I never figured out why it was such an imprecise number. He showed me the soap samples and the ingredient list looked no different from the list from your grocery store…although one of the soaps did include goat milk? He then told us about a recent stop where he had visited a $5 million mansion with a reverse osmosis system treating well water that had TDS levels of 140 ppm…for shame…for shame…and that he was going to convince them to buy a better system from him. As I mentioned above the water quality guidelines are 500 ppm so 140 ppm from well water is pretty darn good. After this discussion it was time to thank the representative for his visit and welcome him to leave.

Once the representative was gone, I had a sit-down with my wife who asked me about all the things she had been told. Having lived with me long enough, she knew that much of what he had said was wrong but did not know in what way. It struck me that this gentleman’s scientific sounding patter would likely sway the uninformed and could convince someone that they needed a water treatment system when all the data he presented proved that we had no use for such a system. A Brita water system would get our drinking water as clean as theirs and frankly leaving a pitcher of water in the fridge does just as good a job at getting rid of chorine as either their system or a Brita. We live in a society where we are constantly informed that everything around us is unsafe. Chemicals are not scary things, they make up everything around us. For a really easy read on the topic I would direct you to a post at “the Logic of Science” titled 5 simple chemistry facts that everyone should understand before talking about science. As for your drinking water? If you live in the British Columbia lower mainland and get your water from the Metro Vancouver water system then no you don’t likely need a reverse-osmosis system costing $8000 when a $1.50 water pitcher you leave in your sink will give you essentially the same quality water

Posted in Uncategorized | 3 Comments

Deconstructing the 100% Fossil Fuel Free Wind, Water and Sunlight USA paper – Part II What about those pesky rare earth metals?

My last post: Deconstructing the 100% Fossil Fuel Free Wind, Water and Sunlight USA paper – Part I Why no nuclear power? introduced my readers to the report in Energy & Environmental Science titled: 100% clean and renewable wind, water, and sunlight (WWS) all-sector energy roadmaps for the 50 United States (100% WWS USA hereafter). In that post I discussed the confusing decision by the authors (Jacobson, Delucchi et al. at http://thesolutionsproject.org/) to consciously ignore the option of nuclear power in their vision for a 100% fossil fuel-free future for the USA and the world. Today’s post will follow-up on my previous post by looking more closely at some of the assumptions underlying this proposed roadmap for our future. As I pointed out in my previous post, David Roberts at Vox.com likened any proposed efforts to achieve a 100% fossil fuel free future based solely on wind, wave and sunlight as requiring a World War II–scale mobilization. My intention in this post is to demonstrate that the proposed approach cannot be achieved, as designed, even with a World War II-scale mobilization. Rather, I intend to demonstrate that even a World War II-scale mobilization by the United States will fail due to an absence of the raw resources (specifically rare earth metals and lithium) needed to achieve the 100% WWS USA paper goal.

As discussed in my last blog posting, the most evident failing of the 100% WWS USA paper is that it lacks the critical data necessary to demonstrate how they will achieve their goal. That is, they describe in detail just how much tidal energy they will need to achieve their goal but they don’t provide any details as to how to ensure that the raw materials necessary to produce the technologies are available. Instead, like the case with nuclear power, all the critical details are in Jacobson and Delucchi’s earlier pair of papers titled “Providing all global energy with wind, water, and solar power”, Part I and Part II (called 100% WWS World Part I and 100% WWS World Part II hereafter). Thus the 100% WWS USA paper provides a broad overview (a strategy) but it does not provide a method to achieve that goal (the logistics). Keeping with the military theme of this post I will remind my readers of the old military saw: “strategies and tactics win battles but logistics win wars”. Well Jacobson and Delucchi’s work is strong on strategies but exceedingly weak on the logistics. So let’s start looking at the logistics.

I really couldn’t go much further in this post without pointing out my previous post On renewables and compromises Part II Rare earths in renewable technologies where I discuss rare earth metals (called rare earths hereafter) and their importance for renewable energy technologies. As I point out in that post, rare earths are the elements that have allowed us to develop all these incredible renewable energy technologies. Neodymium (Nd) is the “magic” ingredient that makes high-power permanent magnets a reality. Lanthanum (La) and Cerium (Ce) are what make catalytic converters work. Your cell phone, your LCD screen, your hospital’s PET scanner all depend entirely on the existence of rare earths. To be clear, we are not talking about traces of the stuff either. A single large wind turbine (rated at about 3.5 megawatts) typically contains 600 kilograms of rare earth metals (ref). European Parliament researchers have established that major deployment of photovoltaic cells and wind turbines may have a serious impact on the future demand of 8 significant elements: Gallium (Ga), Indium (In), Selenium (Se), Tellurium (Te), Dysprosium (Dy), Nd, Praseodymium (Pr) and Terbium (Tb) (ref – admittedly some of those are not rare earths but are mined in similar mines/geologic formations).

So ignoring the issues with nuclear power in the 100% WWS USA paper, another significant problem with the 100% WWS World Part I paper is that the authors gloss over concerns about supplies of rare earth metals. Instead they appear to pretend that we have essentially limitless supplies of rare earths or where supplies are limited that we can easily access the complete planetary resource of these materials with little effort. In their 100% WWS World Part I paper Jacobson and Delucchi note that the annual production of Nd oxide (needed for windmill turbines and anything that needs a permanent magnet) was 22,000 metric tonnes in 2008. They then point out that their 100% world scenario would require 122,000 metric tonnes/year of Nd oxide. That is quite a shortfall considering we aren’t making any serious efforts to address that shortfall.

While most manufacturers of electric vehicles rely on Nd in the same paper they wave away the need for Nd in electric vehicles by stating that we will come up with an alternative for Nd, like Tesla does using Lithium (Li). The problem is that by doing so they just punt the ball down the road since if we are not relying on Nd we are stuck relying on another limiting component Li (to be discussed later). Going back to Nd, Jacobson and Delucchhi wave their hands and look at the global Nd reserves. They suggest that the global reserves can handle their usage numbers for up to 100 years at which point the world will be out of Nd. The question never answered is whether the entire world is going to abandon their historic concerns and frantically mine every ounce of Nd they can find? In my earlier post I point out that any attempt to ramp up mining capacity will require significant political and ecological compromises which might turn out to be a bit challenging. Moreover, some nations may decide that they have other domestic uses for Nd and don’t want the entire planetary supply used to provide the first world with wind turbines?

Having talked about the big name rare earth (Nd) let’s talk about some of the lesser known but equally important ones. Many of my readers will remember that old quotation attributed to Benjamin Franklin that told of “how for want of a horse-shoe nail a kingdom was lost”. Well in the world of renewables that horse-shoe nail is likely the rare earth element Dysprosium (Dy). I will venture a guess that 99.99% of my readers could not place this element on a blank periodic table (I couldn’t and I once had to memorize the periodic table to pass an undergraduate chemistry course). Dy is a critical component of the permanent magnets used in wind turbines and electric vehicle engines and unlike Nd it appears in rare earth deposits in very low concentrations (ref). Over 99% of the world supply of Dy comes from Chinese sources (ref) and under current use scenarios China estimates it has about a 15-25 year supply of Dy (ref note this ref is a pdf file that needs to open on your computer). Because of this, the compound is the top rare earth metal on the US Energy Critical Materials Strategy list (ref) close behind are Nd, Europium (Eu), Te and Yttrium (Yt). Given its importance, and limited supply Dy alone has the potential to upset Jacobson and Delucchi’s version of a clean energy future. Certainly, if necessary, alternatives to Dy will be identified. But it is unlikely that any alternative will provide the efficiency that Dy does in permanent magnets which means that magnets without Dy will be less efficient and thus will not able to produce energy at the rate required to meet their future use scenario. Did you see how that worked? for want of Dy a permanent magnet was lost…for want of a magnet all turbines were lost, for want of all turbines a future scenario was lost. For those of you interested, I strongly advise reading how the US Department of energy is planning to deal with future shortages of these critical rare earths (ref). As I note above, Dy is not the only critical rare earth that is not being produced in any reasonable volumes in the Western world. Eu, Te and Y are also critical components of most of our major energy plans and at this time we simply lack any reasonable supply for them outside of China. What every environmentalist must understand is that any serious effort to move to a 100% renewable future can only be achieved if we make a conscious and concentrated effort to locate, mine and refine rare earth metals in the Western world.

Having discussed rare earth metals, let’s consider the major alternative presented by Jacobson and Delucchi: lithium. As any follower of modern tech trends will point out, Tesla is staking its battery business on lithium and cobalt cathodes and NCA (nickel -cobalt- aluminum oxide) cathodes (ref). This is pretty much what Jacobson and Delucchi suggest will be one solution to the shortage of Nd. The problem is that each battery pack can contain a lot of Li. While Tesla has kept their numbers under wraps it has been estimated that each battery pack in one of those Tesla S 7000 powerwalls uses about 21.4 kg of Li (ref). In 100% WWS World Part I Jacobson and Delucchi estimated that the production of only 26 million electric vehicles would require 260,000 metric tonnes of Li. They point out that at that consumption level we would exhaust the current world reserves of Li in less than 50 years. While 26 million electric vehicles seems like a lot that is only half of the vehicles produced in the world on a yearly basis. Under their 100% WWS USA scenario Jacobson and Delucchi talk about electrifying virtually every mode of land transportation. That would mean a lot more than 260,000 metric tonnes of Li a year and that is only for electric vehicles. It completely ignores any other battery (like the Tesla wall units or even rechargeable AA’s) that might be used to help store all that solar energy that is being collected during the daytime but intended for use once the sun goes down. Jacobson and Delucchi point out that we can always extract Li from seawater; but they also point out that seawater extraction is a very energy intensive process. That energy has not been included in any of their energy budgets. So you see once again the picture looks fine from a distance but once you look up closely you see all these little flaws and like a knitted sweater, once you start pulling at the loose strings things start falling apart.

Well once again a post has got away from me. I was going to go on to discuss platinum but at this point that would simply be overkill. Rare earth metals and lithium form what we in chemistry call a rate-limiting step in the movement towards a 100% fossil fuel free future. Unless and until we can figure out some way to speed up or go around that rate-limiting step the grandest of plans is going to come crashing down to earth in the cold, hard light of day.

Posted in Fossil Fuel Free Future | 13 Comments

Deconstructing the 100% Fossil Fuel Free Wind, Water and Sunlight USA paper – Part I Why no nuclear power?

Last week there was quite a stir as a big report came out in Energy & Environmental Science titled: 100% clean and renewable wind, water, and sunlight (WWS) all-sector energy roadmaps for the 50 United States (100% WWS USA hereafter). The report was picked up by all the normal sources and given a lot of play in the press. It being 2015, the paper even has an interactive website at http://thesolutionsproject.org/. Now as regular readers of my blog know, I did an analysis of what it would take to get British Columbia to a 100 % Fossil-fuel free state and the results were not pretty. I calculated that it would require the energy produced from the equivalent of approximately 12 Site C Dams to get us there and that did not seem terribly promising. Needless to say the idea the United States could achieve a 100% fossil fuel free status was very appealing to me but I was skeptical. Many of the tweets I read made it out to sound relatively simple but one of the bloggers I have come to trust (David Roberts at Vox.com) suggested that it might not be quite that easy. He likened it to a World War II–scale mobilization which sounded about right. That being said, I decided to dig a bit deeper into the numbers to see for myself.

The first thing I noticed about the paper was that the names of the first two (lead?) authors (Jacobson and Delucchi) were very familiar to me. For those unfamiliar with these two, Jacobson and Delucchi prepared a similarly-themed pair of papers titled “Providing all global energy with wind, water, and solar power”, Part I and Part II (called 100% WWS World Part I and 100% WWS World Part II hereafter). I had always meant to dig more deeply into those papers and apparently I will be getting a chance to do that now because the 100% WWS USA paper relies heavily on those two papers for many of its assumptions and raw data.

One of the most interesting features of the 100% WWS USA paper is that it categorically shuts off the option of nuclear fission as part of the energy mix. The basis for this dismissal is an interesting one and almost entirely free of any legitimate concerns about nuclear energy itself. Sadly for the casual reader, the basis for this dismissal is pretty hard to track down. The 100% WWS USA report very briefly discusses why nuclear energy has been summarily dismissed and does so by referring the readers back to two documents. One is the 100% WWS World Part I paper (above) and the second is a paper prepared by a similar batch of authors lead by Jacobson and Delucchi (Examining the feasibility of converting New York State’s all-purpose energy infrastructure to one using wind, water, and sunlight hereafter 100% WWS NYS). The inclusion of the second reference is a questionable one as the 100% WWS NYS paper doesn’t actually provide any original analyses about nuclear power. The sole useful reference to nuclear power simply states “Jacobson and Delucchi (2011) explain why nuclear power and coal with carbon capture are also excluded.” Now you can probably guess what I a going to tell you. Yes, Jacobson and Delucchi (2011) is indeed “100% WWS World Part I”. So in the 100% WWS USA paper they cite two sources to explain why nuclear power is not appropriate for use in the United States. Both sources represent the author’s own work and one is simply a circular reference driving back to the other. As an outsider it looks a lot like they are padding the impact factor of their earlier works while making the average reader believe that their claim is supported by multiple independent lines of research. Going back to the source (100% WWS World Part I) we discover that the basis of the exclusion of nuclear from the mix is discussed but its primary technical basis is derived from a single report prepared by, yes you guessed it, Marc Jacobson and titled “Review of solutions to global warming, air pollution, and energy security”(hereafter Jacobson 2009).

Jacobson 2009 is worthy of an entire blog series of its own because the best I can say is that it is an interesting paper to read. In the paper Jacobson creates a unique scale to define which technologies would make the cut in a future energy mix. I won’t go into detail about all the assumptions that inform the table that I find questionable but for the interested reader I direct you to read the paper and see for yourself. For instance Jacobson indicates that wind energy (a truly dispersed energy source) would have the lowest physical footprint of all potential energy sources because he calculated the footprint of a wind power station to include only “the tower area touching the ground”. Under this approach the Buffalo Ridge Wind Farm in Minnesota which covers 42,800 acres, and has a direct physical project footprint of 77 acres, would occupy less “physical space” than a small city block. Even more amusing is the fact that he classifies wind as having the highest “normal operating reliability” while nuclear is in the middle of the pack. Having written a lot about wind in the last year I can state quite comfortably that the only thing reliable about wind power is that it is reliably absent for a large percentage of the generating year. It may be possible to smooth out reliability by putting enough plants in enough areas to allow for cross-connections but even that has a limited capacity to deal with low wind scenarios (see this ref for a breakdown for Europe). In the same section Jacobson downgrades nuclear energy’s reliability because nuclear plants can have “unscheduled outages during heat waves”. This ignores the realities that heat waves typically involve an absence of wind so while the nuclear plant may have issues relating to over-demand at the same time the wind is sitting idle completely unable to provide supply. Jacobson goes on to point out the actual reliability statistics that indicate that nuclear is a very reliable energy source but discounts those statistics for his subsequent data aggregation.

Jacobson compiles all his data into a single table (Table 4) where he rates/ranks the relative energy sources in order to demonstrate that the technologies he does not like are not viable for use. A brief look at Table 4 shows that nuclear fails the grade due to the risk of nuclear proliferation, some very interesting assumptions about future deaths attributable to nuclear proliferation (threat of nuclear war), thermal pollution from cooling tower return water (which he doesn’t really explain but assumes is a terrible thing) and the potential for disruptions to power supply by terrorists? Remember this paper is serving as the basis for a decision in all his subsequent papers (including 100% WWS USA) to dismiss nuclear energy as an alternative for future energy needs. So yes, you read that right, one of the primary drivers for discounting the use of nuclear energy in the United Sates in the 100% WWS USA paper includes the risk of nuclear proliferation associated with the facilities. Apparently the USA is not a nuclear power and therefore we run the risk of giving the Americans the bomb if we allow those scary folks in Idaho to use nuclear power? The same goes for nuclear powers like the French, the English the Russians, the Chinese, the Indians not to mention the entirety of the NATO alliance and the dozens of countries that have safely used nuclear power for generations without building a bomb. Can you imagine a more ridiculous basis for deciding to omit such a critical energy source from the North American power grid? It is almost as if Jacobson and Delucchi have something against the use of nuclear power and are simply looking for an excuse to exclude it from the mix.

Admittedly, the 100% WWS World paper doesn’t rely entirely on Jacobson’s 2009 paper to dismiss nuclear energy. It also relies on papers by Benjamin Sovacool and Manfred Lenzen. Regular readers of my blog will remember Benjamin Sovacool. I wrote about him in a couple posts Wind Energy and Avian Mortality: Why Can’t We get any Straight Numbers? and When peer-review is not enough – On estimates of avian deaths attributable to coal and nuclear facilities. He was the gent who derived an avian mortality rate for nuclear plants across the US by extrapolating the results from four sources where the biggest influence was actually a nearby fossil fuel plant. In doing so he extrapolated an avian nuclear apocalypse essentially out of thin air. I do not have time to deconstruct the Sovacool 2008 paper so I will leave that to the folks at RationalWiki (ref) who demonstrate that by triple counting a report by Jan Willem Storm van Leeuwen (ref) and ignoring a number of other papers Benjamin Sovacool manages to turn nuclear energy into a bulk emitter of carbon to be shunned. Suffice it to say that the 100% WWS World Part I paper could have chosen any number of meta-analyses to establish the carbon emissions of nuclear energy and the two they chose are arguably the most egregious outliers from the peer reviewed literature.

I think I am done banging this drum. It is quite clear that in the 100% WWS USA paper the authors did not want to include nuclear power in the mix. Based on their previous output, that appears to have been a conscious decision on their part. Please let me be clear here, it is not an inherently bad decision. The authors of scientific papers often make specific decisions in order to do interesting research. The problem, in this case, is that instead of saying outright that they are excluding nuclear power to provide for an interesting research perspective they do so in a manner that smears nuclear power. The same authors who were willing to distinguish to the decimal point the percentage of energy you would need to rely on from tidal turbines in California, were unwilling to distinguish between the risk of nuclear proliferation based on the development of nuclear power plants in North Sudan and those in North Dakota? Going down the list, virtually all of the concerns from the Jacobson 2009 paper are made irrelevant in a US context and yet they form the basis for excluding nuclear power in the 100% WWS USA paper.

I see this blog post is getting a bit long. I had planned on addressing the distressing way the 100% WWS USA paper deals with rare earth metals in this post, as well, but I think that should be the topic for a future blog post instead.

Posted in Fossil Fuel Free Future | 8 Comments

More on that "Toxic Benzene Plume"

Today’s blog post is intended to provide some further commentary on the “toxic benzene plume” from my previous blog post: Questions about the City of Vancouver May 27th Trans-Mountain Expansion Proposal Summary of Evidence. As readers of my blog know, the Trans Mountain Pipeline Expansion Proposal (TMEP) Summary of Evidence (SoE) presented to the Vancouver City Council on 27 May 2015 (ref) included the results of a modelling exercise which suggested that:

a major oil spill from Kinder Morgan’s Trans Mountain pipeline expansion project would expose up to 1 million Metro Vancouver residents to unsafe levels of toxic vapours, and as many as 31,000 could suffer “irreversible or other serious health effects,”(ref).

Needless to say this conclusion garnered a lot of headlines. I saw stories from the Georgia Strait to the Globe and Mail. The problem is that, as I described in my last post, this conclusion fails the smell test. The modelling exercise incorrectly compared the toxicological characteristics for benzene to a “pseudo-component surrogate” that was made up of a mixture in which benzene was a very minor constituent. This resulted in a wildly overstated risk to the public which, I will admit, made for some pretty nifty headlines. This post is intended as a follow-up to my previous post to explain the “surrogate thing” as well as to relate some surprising additional information I have uncovered since my last post.

As discussed, the biggest question from my last post was “what is the deal with the surrogate”? Well the chemical definition of a surrogate is:

a pure compound different from, but similar enough to, the analyte that, when added at a known concentration to the sample prior to processing, provides a measure of the overall efficiency of the method (recovery). Surrogates have chemical characteristics that are similar to that of the analyte and must provide an analytical response that is distinct from that of the analyte (ref).

While the Levelton Consultants Ltd report (the Levelton report served as the basis for that portion of the SoE) uses the term “surrogate” in a chemical context they did not use the term under its chemical definition. Rather they used the non-technical definition of the term: “one that takes the place of another; a substitute” (ref). As I pointed out previously, modelling is hard and to simplify the modelling Levelton took the theoretical oil in the spill and broke it into 15 “pseudo-components” each of which was then assigned a surrogate for use in subsequent toxicological calculations. One “cut” of the dilbit was assigned the surrogate “benzene”. As I described previously, this resulted in badly skewed risk results because benzene is by far the most toxic component in the “cut” of dilbit for which it was used as a surrogate and appears in the dilbit in much lower concentrations than used in the model. As an analogy, imagine you were tasked with compiling a survey of the animal population of Vancouver. To simplify the survey you didn’t ask your surveyors to try to identify the dogs by species instead asking them to group the dogs by size. For a subsequent risk analysis you then assigned the pit bull as a “surrogate” to describe the behaviour of all dogs smaller than 2 feet tall identified in your survey. Would you then feel comfortable with the outcome of that risk analysis knowing that the analysis treated every Chihuahua it counted as if it were a pit bull for risk purposes? If someone subsequently warned you to stay off the street for fear of being attacked by “surrogate pit bulls”, based on this analysis, would you stay off the street? Well that is what they did in this report with benzene.

As a follow-up to my last post I also did a bit of digging into the documents referred to in the Levelton Report. Specifically, I located the Intrinsik and Tetra Tech EBA reports (caution both are large files that take a while to download) used to rationalize the use and choice of surrogates in the modelling exercise. The TetraTech EBA report does indeed use “pseudo-components” as surrogates; however, in their analysis “benzene” is used as a “surrogate” only for the benzene component in an oil spill (confusingly it is thus used as a surrogate for itself only). As such instead of representing around 1% – 2% of the total spill mass (best guess on the number used by Levelton) it was determined to represent 0.088% of the spill mass (a fraction based on the Tetra Tech EBA analysis of the future pipeline composition). In the Intrinsik report, “benzene” is also restricted to the actual benzene component of the dilbit and for toxicological calculations only benzene is compared against the acute inhalation exposure limits for benzene. So when the Levelton report claims to follow an approach that “is consistent with the approach taken with the Human Health Risk Assessment (HHRA)” that consistency does not extend to how they approached the critical component described in the SoE and the one that garnered all the headlines: benzene.

The biggest surprise in my follow-up reading was to discover that this was not the first modelling exercise to examine benzene vapour concentrations derived from a theoretical oil spill in Vancouver Harbour. As I described in my previous post, what made my chemist’s antenna go haywire was the model output which said that in the case of a spill thousands of City of Vancouver residents would be exposed to benzene concentrations over 800 parts per million (ppm). As I pointed out, previous in situ studies (actual studies in the field) of oil spills of comparable API gravity crudes had measured benzene concentration ranging from 7 ppm to less than the detection limit (ref). A study of a lighter crude (with more volatile components than dilbit) (ref) and sampled from a mere 2.5 cm above the oil surface measured instantaneous benzene concentrations ranging from 80.4 ppm to 3.5 ppm. Finally, most everyone in the modelling community must have heard of the modelling study of the Exxon Valdez spill (ref). It, too, got a very similar result to the in situ experiments. Thus, when I read the Levelton report I was more than a bit surprised by the output from their model. Well imagine my surprise to discover that the Tetra Tech EBA report, used as a reference by the Levelton authors, actually included a modelling exercise almost identical to the one carried out by Levelton. The difference was that the Tetra Tech EBA modelling used benzene proportionate to its concentration in dilbit. Unsurprisingly, the resulting outputs were entirely consistent with the academic literature. The maximum 1-hour average ground concentration for benzene was less than 100 ppm over the small portion of Vancouver affected by the spill. Certainly not headline worthy, I will admit, but entirely consistent with the rest of the science out there. Nowhere in the Levelton report, which otherwise references the Tetra Tech EBA report, do they contrast their results to those generated by Tetra Tech EBA. It is almost as if they didn’t want anyone to know that the previous modelling exercise had been carried out and had generated such non-threatening (boring? non-headline worthy?) results.

In the academic community there is a simple rule: if a new study runs contrary to a body of research then it is incumbent on the authors of the study to explain the discrepancy. Sometimes the new study is a paradigm changer, but most of the time it represents an outlier of dubious use in decision-making. Unfortunately, the Levelton report does not explain why its results differ so dramatically from the scientific consensus. More troublingly, it does not even acknowledge the existence of the body of research out there, including an almost identical modelling study, that came to such startlingly differing conclusions. I’m sure the Vancouver City Council, and the local media, would be as interested as myself in finding out why such an outlier result was trumpeted on May 27th?

Posted in Canadian Politics, Environmentalism and Ecomodernism, Risk | 2 Comments