As regular followers of this blog know, my graduate research involved developing systems to allow data collected by researchers to be evaluated for reliability and made available for subsequent re-use by other researchers. I carried out my research in an era before the wide availability of computerized statistics programs. As a consequence, all my statistical calculations were done with a calculator and statistical look-up tables. Due to the difficulty in completing these analyses, we were taught some very important lessons about evaluating research studies. In this blog post I want to share some of those lessons while examining the most recent paper from the Ramazzini Institute 13-week pilot study on glyphosate.
To do this, I am going to introduce a couple important concepts in science (Type I and II errors and p-values) and then use that information to explain why the study, as designed, could not come to any definitive conclusions. Or put another way, because of the study’s design it is virtually impossible to derive any definitive conclusions from the research and any activist attempting to do so needs to spend more time learning about the scientific method.
Type I and Type II Errors
In science we identify two primary types of errors (okay some argue there are at least three types but I will not go into that today):
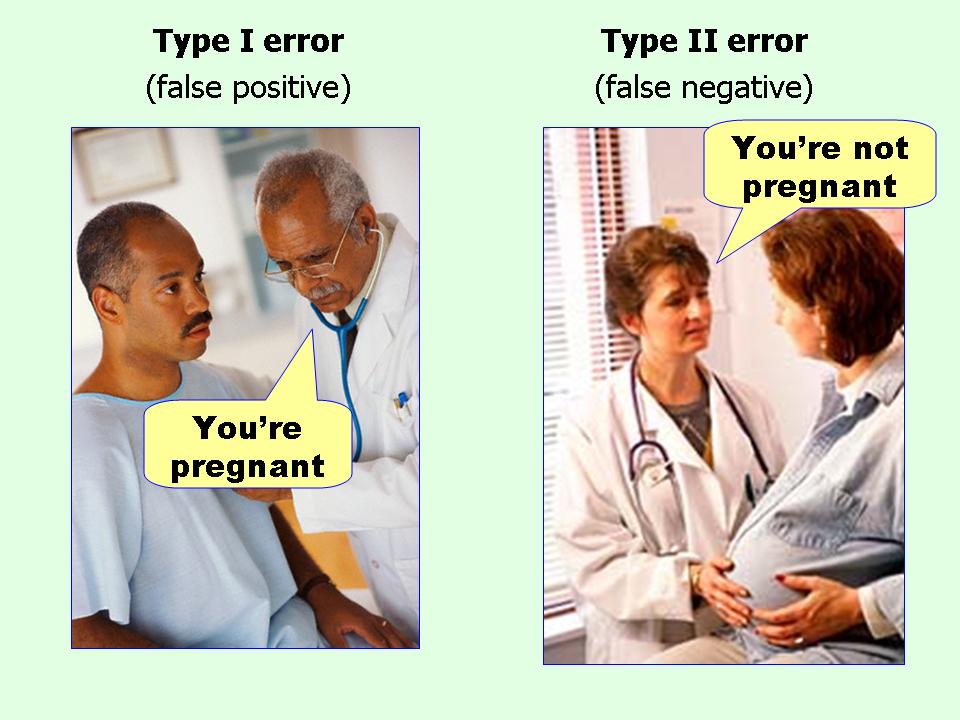
- A Type I error, which represents a false positive, involves claiming that an observed hypothesis is correct, when in reality it is false.
- A Type II error, which represents a false negative, involves claiming that an observed hypothesis is incorrect when it is actually correct.
In my opinion, the best visualization of the difference between the two is this graphic: (which I have seen in numerous locations and whose origin I have been unable to confirm although I believe it comes from the “Effect Size FAQ“).
The tools used to avoid Type I errors mostly involve better understanding the nature and characteristics of the populations under study. It is generally accepted by the scientific community that an acceptable risk of making a Type I error is the 95% confidence level (a p-value of 0.05). In order to derive an acceptable p-value, certain characteristic of the population must be understood. Primarily its distribution, or lack of an understood distribution.The details of how statisticians evaluate populations for this purpose involve mathematics that I won’t go into today.
The tools used to avoid Type II errors are less well-refined (but are getting better every day). Most depend on improving our understanding of the nature of the distribution that is being tested. Lacking that understanding an increase in sample size will increase the power of an analysis and reduce the likelihood of a Type II error.
P-Values: what do they mean?
P-Values are one of the most misunderstood features in research. A p-value helps you establish the likelihood of a Type I error. It does nothing to help avoid Type II errors and has absolutely no information about whether your results are “right” or “wrong”. Remember in science all results are right since they represent observations. It is just that some observations may help support a hypothesis while others may not.
As described in this article in Nature, when Ronald Fisher introduced the p-value in the 1920’s he did not mean for it to be a definitive test but rather one tool in the researcher’s tool belt. Nowadays there is an entire edifice in science built on the importance of achieving a p-value less than 0.05 (see a xkcd comic which makes fun of that idea). The problem is that a low p-value is not a proof of anything. A p-value simply provides the probability of getting results at least as extreme as the ones you observed. A really clear write–up on the topic is provided in this link. Unfortunately, even practicing scientists have a really hard time explaining what a p-value represents.
As I mentioned above, a p-value indicates the likelihood that an observation supports your hypothesis. At a p-value of 0.05 (95% confidence) we still have a 1 in 20 chance of being wrong (a Type I error). My son loves playing Dungeons & Dragons and in that game 20-sided dice are used for all battles. Roll a natural 20 (a critical hit) and your level 1 barbarian actually hits the other guy’s level 18 druid. Roll a 1 and your level 12 barbarian can’t even hit a wall.
Now the truth every D&D player knows is if you roll the dice enough times eventually everyone rolls a 20 and everyone rolls a 1. That is how statistics works. It is also true that speaking from a purely statistical stand-point it is incredibly unlikely that any one person will win the lottery, but eventually every lottery prize gets won. So when someone gets a “significant” result in a study you need to examine how many times they rolled the dice and how well the researcher understood the relationship between the observations and the conclusion. False correlations happen all the time in science and are so common there is a great web site dedicated to the more entertaining examples.
The Ramazzini Institute 13-week pilot study on Glyphosate
This brings us to the the “Ramazzini Institute 13-week pilot study on Glyphosate”. This is a project intended to try and find whether glyphosate has a potential effect on various human health endpoints. This research project appears to have started with the assumption that these impacts exist and so is using a shotgun approach to try to find topics for further study. So what have they done in this study?
In the study cited they exposed a relatively small number of rats to glyphosate in two forms, as pure glyphosate and as the Roundup formulation and then did all sorts of measurements and assessment to see if any significant effects were observed.
Now remembering what we read earlier look at the paper the number of times they rolled the dice. They generated eleven tables with dozens and dozens of comparisons between the treated mice and the controls. As you can expect, in the end they found a number of “significant” differences, but should we be convinced by this fact? Once again I direct you to an apt comic from xkcd.
Well, let’s start with the obvious question: since both glyphosate and Roundup have the same critical active ingredient you would expect the two treatments to have the same effect. So any case where only one of the two treatments had an effect should raise some red flags. From the Type I error perspective, given the number of comparisons that were made, this outcome would not represent anything different than you would expect by simply rolling 20-sided dice. There was one single occurrence where both the glysophate and Roundup significantly differed from the control, but once again given the number of comparisons that is not an altogether unexpected result.
How about false negatives? Well from a Type II error perspective, the number of rats in the study are so low as to not really prove anything either. Look at this study of “Pesticide use and risk of non-Hodgkin lymphoid malignancies in agricultural cohorts from France, Norway and the USA: a pooled analysis from the AGRICOH consortium“. They looked at 316,270 farmers accruing 3,574,815 person-years of exposure to glyphosate and found no effect. This puts the inclusion of 99 rat pups in this study into perspective doesn’t it.
So what is the point?
By now a lot of you are likely asking: if the study had little chance of coming to a solid conclusion what is the point of this type of study? The simple answer is a pilot study is exactly that, a pilot study. You throw stuff at a wall to see if anything sticks. If something does stick then that is a good direction for further research.
Due to its small sample size; massive number of potential comparisons; and lack of refinement all a pilot study of this type does is sets the project up to do a more directed study sometime later. Another research group can use the information from this study to design an experiment to see if the initial observed correlations can be repeated. Until those more-detailed studies are done, the results from this pilot study really tell us nothing useful about whether glyphosate is the cause of the observed changes or whether those numbers are simply the result of a random roll of the dice.
Conclusion
As I finish this blog post I know the question I am going to be asked is: well did glyphosate have an effect or not? My response is: I don’t know and neither do the authors of this study. The study was not designed to answer that question and as such is unable to do so but rather opens up directions for future investigations. The only people who are going to express certainty about the outcome of this study are activists who will trumpet it as proof that glyphosate is a danger. Because of the study’s design it is virtually impossible to derive any positive or negative conclusions from the research but that won’t stop the activists or their friendly journalist friends who love a scary headline. All I can hope is that if enough observers understand the limitations of sample design and statistics they will call out the activists when they make these inaccurate statements.

Blair, another great explanation….
LikeLike
Your last paragraph explains exactly why the study was done.
LikeLike
Actually Robert Wagner, this explains why the study was done:
LikeLike