Another day has passed and another report has been released about the viability of the Trans Mountain Pipeline Expansion Project (TMX). This new report titled “Trans Mountain Pipeline – Financial and Economic Considerations – Update” was produced by the Parliamentary Budget Officer (PBO) to provide an “updated analysis of the Trans Mountain assets“. It takes little imagination to guess that this report was immediately seized on and misconstrued by activists who claimed:
and
Needless to say the PBO report says nothing of the sort. Rather, the report presents a number of conservative scenarios, some well-founded, some ill-founded, to assess the net present value (NPV) of the TMX. Here is the critical graph from the report:

As I will describe in the blog post, this graph, with all its red ink, is not actually representative of the expected profitability and wealth-generating capacity of the TMX. Rather a careful read of the PBO report shows that the TMX remain a project that will increase our national wealth while turning a profit for its owners.
The PBO report presents five major assumptions used in developing their NPV estimate for the project:
- In-service date,
- Construction costs,
- Pipeline utilization
- Long-term Discount rate, and
- Service and tolling framework
I have no issue with their assumptions for “In-service date” and “Construction costs”. These variables are consistent with generally accepted ranges. As I will detail below, I have a serious disagreement with the report’s choice of discount rates; pipeline utilization; and service and tolling framework.
In my mind, the PBO report uses an overly conservative long-term discount rate. The discount rates chosen would be appropriate for a private sector project, where the private sector entity had to borrow on the private equity market, but that is no longer the case for the TMX. The TMX is a government project now and the analysis should assume a discount rate consistent with what the government uses for other infrastructure projects. Those values tend to be below 8.0% not 8.5% or 9.0%. Thus, in my mind, we can eliminate the 9.0% columns in the table above.
My biggest complaint with the report is with the arguments used to justify the choices in the “Service and Tolling Framework after 20-year contracts expire” columns. I will start by noting that others are also confused. One economist I follow on Twitter noted:
My argument is with the PBO report’s suggestion that after 20-years the existing shippers will not want to sign contracts in scenarios where Canada takes action on climate change. To the best of my knowledge their argument is based on a misunderstanding/ misinterpretation of the Canada Energy Regulator (CER) “Canada’s Energy Future 2020” report. I describe the general misunderstanding in my earlier blog post but will summarize here. In the CER report they include this graph:
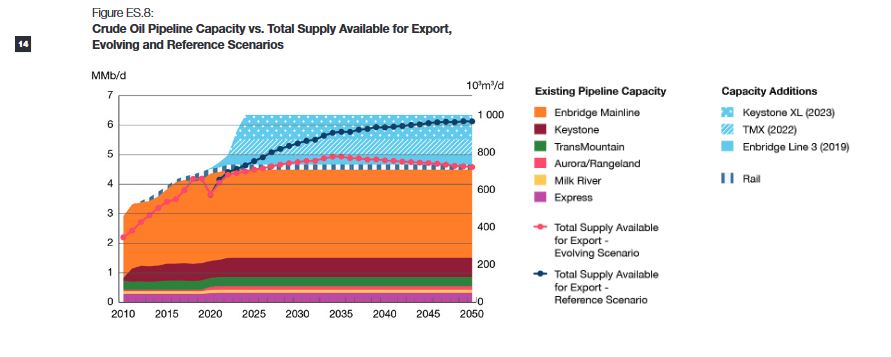
The CER, in the production of their graph, made the editorial decision to insert pipelines into the graphic based on completion dates with the older pipelines on the bottom and the newer ones on the top. This graphical choice is not intended to indicate the rate at which various pipelines will be chosen to move product. It was simply an editorial choice in making the graph.
Many activists (and the PBO) appear to believe that if Canada acts on its climate commitments then based on this graph the TMX and Keystone XL will be the first to lose product. Alternatively, they may believe that if there is excess capacity in the overall transportation network then the excess capacity will be spread evenly across all means of oil transportation.
These assumptions are not correct. Should Canada achieve excess transportation capacity the reductions will come based on costs to transport the oil, the risks of oil transportation and markets served by the transportation medium rather than simply being spread evenly across all mechanisms. By looking at which markets are served by which pipelines we can establish who will lose their market share first if we end up with excess carry-out capacity. This is where the PBO report gets it particularly wrong about the TMX.
The TMX is the only route that terminates on the Pacific West Coast. As such. the TMX is the only pipeline that can effectively serve markets in California, Washington State, British Columbia and, of course, Asia.
Thus, the suggestion that shippers will suddenly decide, in 20 years, to not lock in supply on the only pipeline that services the Parkland Refinery in Burnaby or the BP refinery on the Puget Sound makes zero sense. Similarly, the heavy oil refineries in California will be looking for certainty in supplies. The suggestion that shippers will go 100% with the cost-of-service model, with all its uncertainties, simply makes no sense. Some shippers will continue to lock in their commitments because the Trans Mountain is the only way they can affordably get their product to these markets.
Thus, looking at Table 3.2 above we can eliminate the 100% cost-of-service columns and the 9.0% discount rate columns. By doing so we get rid of a lot of red columns and what we get is a NPV range from +2,300 to -1,800. The general trend seems to be about plus or minus $1 billion in NPV over the lifetime of the project.
But Blair, I hear some asking, doesn’t that mean we shouldn’t build the pipeline, it may have a net negative NPV?
My response is that even if the TMX ends up with a net negative NPV it would still be worth building because of the value it will generate for the economy. After all we don’t expect our other infrastructure projects to have a positive NPV, instead we look at whether they can increase productivity and grow the economy. We invest in infrastructure because it generates wealth.
This is the part of the PBO report the activists have carefully avoided. Section 4 of the PBO report describes both how the construction of the pipeline will impact real GDP and employment and more importantly will increase optionality. As the report notes:
Optionality refers to the availability of more pipeline export capacity to more downstream markets for Western Canadian oil producers. Optionality allows shippers more opportunities to maximize returns and reduce the netback disadvantage, reflected in the price differential between West Texas Intermediate (WTI) and Western Canadian Select (WCS)
The PBO later notes:
That analysis determined that a reduction in the WTI-WCS price differential of US$5 per barrel would, on average, increase nominal GDP by $6.0 billion annually over 2019 to 2023″.
and presents the following graph:
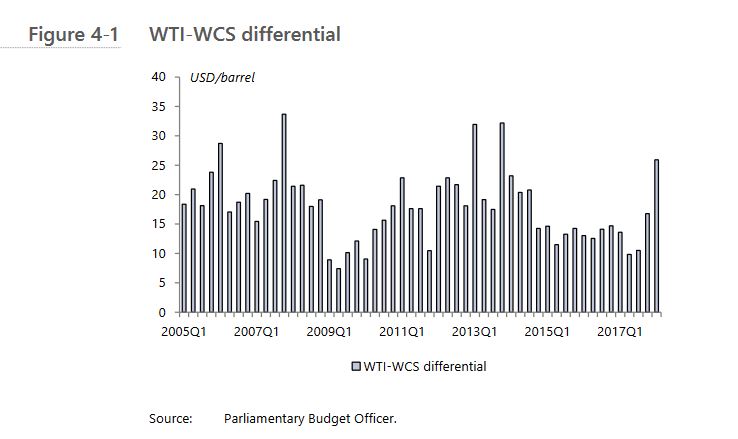
Look at that graph. In 2018 the WTI-WCS price differential was as high as $30/barrel.
If we assumed the Trans Mountain, Keystone and Line 3 reduced the differential by only $5 barrel that would be an increase in GDP of $6 billion. That $6 billion a year for every $5 reduction in differential is $120 billion in GDP over the first 20 years of operation of the pipeline. Recognize, this economic growth does not come at any additional GHG or environmental costs. We aren’t selling more product or being more efficient getting it out of the ground. This value simply derives from getting a better price for the same product. It is clean growth with no environmental downsides.
Even if the pipeline lost a billion in NPV it would more than pay for itself in the improvement in GDP and increases in government revenue. Put simply, that is why governments invest in infrastructure. By investing in critical infrastructure the government can generate wealth for the nation and the Trans Mountain looks likely to generate massive wealth to help pay for all the other services we rely on from Medicare to clean drinking water. So when West Coast Environmental Law argues that it is:
I would counter that by investing in wealth-generating infrastructure, like the TMX, the government will be able to generate the tax revenues to help it deliver safe drinking water to all its communities.
To conclude: as I have written repeatedly, the Trans Mountain will be a shipper of choice for decades to come because, unlike Keystone XL, it does not compete with the Enbridge system shipping to the US mid-west and Gulf Coast. As long as this is true then the PBO analysis makes it clear that the project will have a positive NPV. Moreover, not only will the Trans Mountain be profitable, but it will generate wealth by decreasing the WTI-WCS price differential which will grow the economy and generate more government income. While we cannot be sure by how much the TMX will reduce that differential, we can be certain that it will. In doing so, the TMX will almost certainly be profitable while simultaneously serving a critical role in generating GDP and government revenue. It is a win-win project.

Thank you for writing these detailed analyses. I really appreciate your writing in our 21st century era of 160 character sound-bites.
For reasons you pointed out, the final NPV is not going to be contingent on whether spot capacity is utilized (your argument, summarized, “as long as the pipe is the only link to the west coast, it will be” I agree with). As such, the discount rate is the strong variable in this report. Section 2.1 of the report outlines how they came to their 8-9% discount rate (using WACC), but one can make comparisons to Enbridge, which has their unsecured debt maturing in 2046 at a 3.6% yield to maturity at present. GoC debt has the advantage of being secured by the Crown, and commands less yield (GoC debt maturing in 2047 is about 1.25% right now, although a fairer comparison would be to another Crown corp, e.g. NAV Canada trades at about a 125bps spread above GoC). Applying a 6% equity premium over debt is a very high discount, especially in the current near-zero interest rate financial environment. At a lesser discount rate, the project is well profitable in even the PBO’s pessimistic scenarios (higher capital cost of construction, – 5pp utilization, and cost of service after 20 years).
Predicting the future 20 years ahead from now is clearly not an exact science and the PBO report takes a very conservative assumption that demand to pipe crude to the west coast will be tepid.
Also those not versed in finance would think that a 0 (or negative) NPV means the project is not profitable and thus should not be constructed; it just simply indicates that future cash flows at the discount rate is neutral with respect to costs to obtain such cash flows. Spin doctors can simply use higher discount rates to show “losses”, and then claim it should not be constructed. Likewise, proponents can use artificially low discount rates to show it is wildly “profitable”. In both cases, it preys upon the lack of financial knowledge of their readers and instead is just moving a financial measuring stick.
Either way, busting through the ~US$15/barrel WCS differential is going to generate significant value. We’re also going to see this on the dry gas side, the outlet for LNG (coastal gaslink) will also create significant value over the next couple decades – LNG (Japan, South Korea, etc.) to AECO/Dawn/Henry Hub differentials will surely spread as the demand impacts of COVID-19 abate.
LikeLiked by 1 person
Sacha, I’m always eager to learn. Maybe you can be of assistance.
It is my understanding that the NPV discount indicates a kind of risk percentage that a project:
1- Isn’t as good as it originally looked and is stopped
2- Doesn’t get financed
3- Doesn’t get permitted
4- Runs out of money and is re-financed -> bag-shareholders
5- Whatever problems (sky coming down) that may arise that will lower calculated NPV
TMX is already well underway, many hurdles have been taken and the chance that it will be built and will be successful has increased. Government support, for the good of the nation, etc. etc.
If in KM-time, it would have rated NPV-9%, surely now it could be NPV-6%?
At this stage, I find the 8% already high. Could you please explain?
Thanks.
LikeLiked by 1 person
Pingback: Why the cancellation of Keystone XL is bad for the climate, the environment and Canada | A Chemist in Langley
Pingback: Why Climate leaders sometimes build pipelines – understanding the climate implications of the Trans Mountain Pipeline Expansion Project | A Chemist in Langley
I’m coming in very late to this party, but it just struck me that the CER analysis is presenting the TMX NPVs “…net of the purchase price paid by the GoC to acquire the TMP system.” I *think* they mean the results include that expenditure as a cost – but it shouldn’t be. That’s a sunk cost – cancelling TMX doesn’t get that money back – so the NPV of future cash flows (which is all we care about, because past cash flows can’t be changed) is higher across the board by the $4.5Bn paid for TMP.
People’s wording can get sloppy particularly when they are using terminology like ‘net of XXX’ – they might mean the exact opposite!
LikeLiked by 1 person
Pingback: Why an over-budget Trans Mountain Pipeline Expansion Project will still not be a financial loser for the Federal government | A Chemist in Langley