I am a pragmatic environmentalist. I have worked in the environmental field for over twenty-five years. My area of professional expertise is the investigation and remediation of former industrial and commercial sites with a specialty in the assessment of petroleum hydrocarbon contamination and its effects on human and ecological health.
In my professional capacity I serve as a technical specialist in: industrial chemistry; the biodegradation of contaminants; the effects of contaminants on natural systems; and ecosystem restoration. I have no connection, financial or otherwise, to Kinder Morgan or the Trans Mountain pipeline but I have some strong opinions on the project which are based on my personal experience and specialized knowledge of this field. I have spent the last 16 years cleaning up the messes made by the generations before me. I have seen the consequences of oil spills and industrial activities first-hand and I recognize that all industrial activities have environmental consequences.
We live in a society that, like it or not, is dependent on oil (petroleum hydrocarbons) and petroleum hydrocarbon-based products. Our food is produced on farms that need heavy equipment to operate. That food is shipped around the world by air, water and rail, all of which rely on petroleum hydrocarbons to operate. Petroleum hydrocarbons also serve as the feedstock of the petrochemical industry, which forms the basis of all the things that make our modern world work. They are the building blocks of our plastics, our computers, the tools we need to keep us healthy and the drugs we take when we are sick.
In 2015 world leaders passed the Paris Agreement. As part of the process Canada agreed to drop our greenhouse gas emissions to 30 per cent below 2005 levels by 2030. Irrespective of what many activists may claim, Canada did not commit to trashing our economy nor did we agree to abandon all fossil fuels. Canada certainly did not commit to achieving a fossil fuel-free status in less than two decades. I have read many recent articles written by activists who repeat ridiculous claims like: “new research shows that the fossil-fuel era could be over in as little as 10 years.” As I have demonstrated at this blog, the claim that we could eliminate our reliance on fossil fuels in the next 10 years does not even rise to the level of laughable. It is simply magical thinking. If we undertake herculean efforts and dedicate a historically unprecedented per cent of our national gross domestic product to the task we have a reasonable chance of weaning ourselves off fossil fuels in 30-50 years. Even then it is likely closer to the 50-year than the 30-year timeline. What this means is that Canada has, and will have, an ongoing need for fossil fuels for the foreseeable future.
A point seldom discussed by activists is the costs. As I noted, the effort to wean ourselves off fossil fuels is going to be incredibly expensive. That money has to come from somewhere. That somewhere is the Canadian tax base and the way to build that tax base is to take advantage of Canadian natural resources not to undercut them.
I know that the term “ethical oil” has some blemishes because of issues surrounding its origin, but I believe in the concept behind the term. As a Canadian I want my personal gasoline purchases to go towards subsidizing medicare and not subsidizing a despot or paying for a tyrant to bomb his neighbour. I want to know that the oil used in my car was not generated using slave labour in a country without a free press, and where environmental regulations are noted by their absence rather than their application. I want my oil being produced by well-paid Canadians in a country with a demonstrably free press, strong government oversight and a strong tradition of NGOs to watch over the regulator’s shoulder.
As a Canadian I will point out again that Canadian oil helps support Canadian jobs and Canadian institutions, and provides the funds to pay for our education and medical systems while subsidizing transfer payments. This brings us to the Trans Mountain Expansion proposal (TMX). The TMX has two major components:
- Line 1 would consist of existing pipeline segments (with pump upgrades) and could transport 350,000 b/d of refined petroleum products and light crude. It has the capability to carry bitumen but at a much reduced volume per day. Notice that absent the heavier bitumen it can carry an extra 50,000 b/d. Line 1 is intended to help mitigate the supply bottleneck that has Vancouver drivers paying such high prices for gasoline and diesel.
- The proposed Line 2 would have a capacity of 540,000 b/d and is allocated to the transportation of heavy crude oil. This new pipeline and configuration setup would, add 590,000 b/d to the existing system for a total capacity of 890,000 b/d.
Freeing up Line 1 will allow the west coast to become less reliant on foreign imports and provide a means for the Sturgeon refinery to get its production to BC. Meanwhile, a big complaint is that much of the increased pipeline capacity is for “export”, but “export” can mean a lot of things. It is likely that a major “export” location for Trans Mountain oil will be the Puget Sound with most of that increase traveling along the existing upgraded pipeline. Much of the remaining export will be to California which is also suffering from a heavy oil shortage. Due to its proximity, tankers from Vancouver to California will be the cheapest way for California to get heavy fuel which means Albertans will get the best price for that oil (as there will not be a transportation premium).
As I wrote in my previous post the current pipeline capacity to the West Coast is inadequate to supply demand. The volume in excess of demand still needs to get here so where is it going to come from?
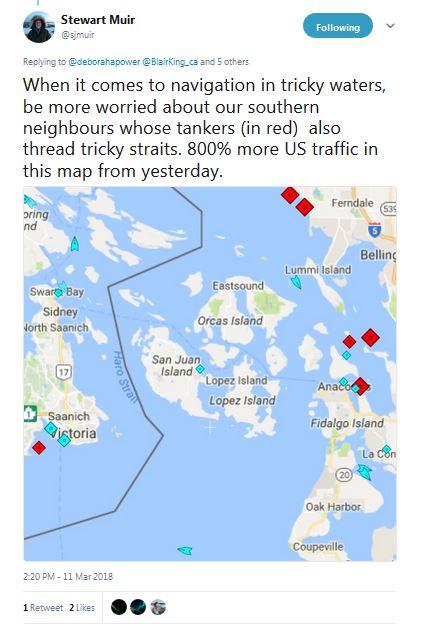
- Absent the TMX we will be seeing more foreign tankers in Washington waters. Those tankers will not meet the stringent safety requirements that the NEB has imposed on the TMX ships but those tankers will be still sailing through the same “treacherous” waters. So we see a significantly higher risk from tanker spills.
- Absent the TMX upgrade we will see a significant increase in oil-by-rail to the Puget Sound (Bakken oil transported along the Columbia River Valley).
- Absent the TMX we will see continued movement of oil-by-rail to the Lower Mainland down the Thompson and Fraser River valleys. A spill on any of the rivers is more likely by rail than by pipeline and would cause untold damage to endangered fisheries.
So what are we looking at if the activists manage to stop the TMX? Certainly not a decrease in ecological risk. Rather we will see an increase in risk to our rivers and the marine environment…and at what cost? Any rent-seeker who thinks that blocking the pipeline will somehow help us fight climate change is barking up the wrong tree, because the countries that will serve as the replacement for Canadian oil (the Saudis, Nigerians and Algerians) are not paying into our federation; they are siphoning money out of it. If you want your bridges, roads and sewage plants built/repaired, then you are going to need money and blocking the Trans Mountain is exactly the wrong way to obtain those funds.
As I have written numerous times at my personal blog, we need to wean Canada off fossil fuels as our primary energy source. If we are to avoid the serious consequences of climate change, we will need to eliminate fossil fuels from our energy mix. However, contrary to what many say, the process of doing so will take decades, and in the meantime we will still need petroleum hydrocarbons.
So, the question that must be asked is: from whom do we want to source our needs? From Canadian provinces that pay into equalization or from foreign despots who use the money generated to fund wars and underwrite totalitarian regimes?
The reality is that you can’t have a legitimate discussion about the topic of oil without considering the ethics underlying our oil supply. Regardless of branding, ethical sourcing has to be part of the discussion. As a pragmatic environmentalist seeking only to ensure a healthy economy on a healthy planet, I would be remiss if I ignored this topic.
Some commentators say we should get out of the oil business and cede the field to the despots, the tyrants and the murderers. I disagree. I see a need to supply the Canadian market with Canadian oil, produced by Canadian workers who pay into the Canadian tax system and thus underwrite the costs of Canadian civil services, the Canadian way of life and the Canadian move away from fossil fuels.
Put simply, I want the funds generated by Canadian oil to help fund our Canadian transition away from our dependence on fossil fuels. The first step in that process is getting that oil to market in the safest, least environmentally harmful manner and that means via pipeline. Most importantly, blocking the pipeline is not going to reduce our dependence on fossil fuels, rather it will simply redirect the crude to less safe means of transport while simultaneously reducing our economic ability to fight climate change. One might say we will end up with the worst of both worlds, a greater risk to the environment and less financial ability to finance the fight against climate change.