
As I noted in my previous post, I sent in my submission to the BC Utilities Commission (BCUC) Site C Dam Inquiry. As a matter of personal interest, I have been keeping abreast of the other submissions. A number have been interesting; several are essentially useless; and two even earned their own DeSmogCanada blog postings. Specifically, former BC Hydro CEO Mark Eliesen’s and former Premier Mike Harcourt’s submissions. Mr. Harcourt’s submission also had the benefit of appearing as an opinion piece in the Vancouver Sun. What I have found interesting about many of the submissions I have read is that they make arguments that are difficult to either support or refute with readily available data. I blame this on BC Hydro which has not seen fit to provide the data necessary to facilitate reasonable policy discussions. To satisfy my curiosity I went to the BC Hydro Annual Reports page; downloaded the online past annual reports and compiled a spreadsheet of the data produced by the organization since 2002. This blog post will summarize some of the findings (all data are from the applicable Annual Reports unless otherwise cited).
Needless to say the information of note was typically not very easy to find. But hiding deep in the appendices were the financial operations statistics tables which break out the supply/demand situation in BC. What I found provides a far more complex and interesting picture than has been suggested by the people fighting against the Site C Dam and should really inform any reasonable evidence-based, decision-making process.
There first thing I must say about the BC Hydro statistics is that the data are very noisy. That is tech-speak for the fact that the data have a lot of year-over-year variability and trying to find a signal in all that noise can be challenging. Just look at how domestic electricity demand has varied over the time-frame investigated:
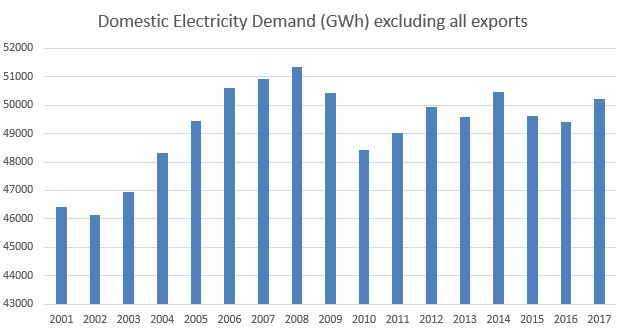
Total domestic demand showed a steady increase until the 2008 market crash. Following the market crash the economy contracted and this was visible in an observable decline in electricity demand. Remember BC Hydro statistics are not calendar years but rather financial years so post-crash impacts were not fully observable until the 2009-2010 financial year. Following the crash the economy started to recover and total demand has varied within a reasonably tight range since about 2012. When you strip out the Industrial users the trends in the data become a bit clearer.
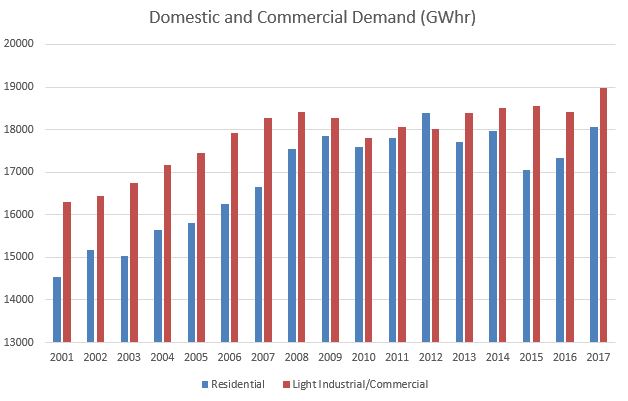
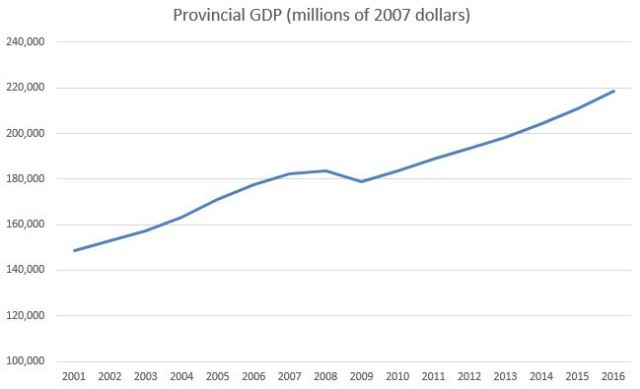
Light Industrial and Commercial use rose steadily to 2008, dropped a bit during the recession and has been generally increasing as we have dug ourselves out of the hole created by the recession. At first glance Light Industrial and Commercial demand appear to mirror provincial gross domestic product quite nicely (source).
Residential use, meanwhile, has had a different pattern. A lot of this has to do with how we use electricity in BC. Natural gas is still the primary means of heating homes and hot water for residential users but more-and-more households use electricity for heating and cooking. This means that residential use will be higher in years with cold winters (2012) and sink in years with warm winter (2015). The critical consideration for any discussion in the future, therefore,would be the number of residential accounts:
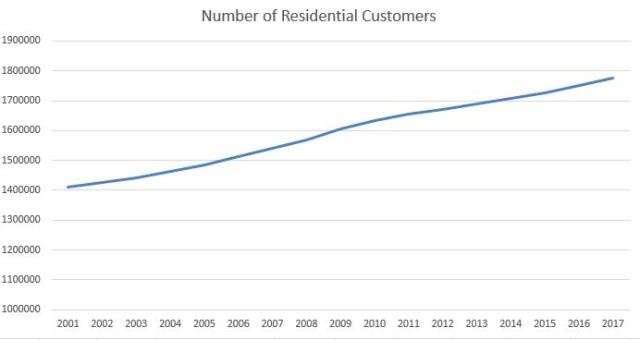
and the average annual annual consumption per residential customer.
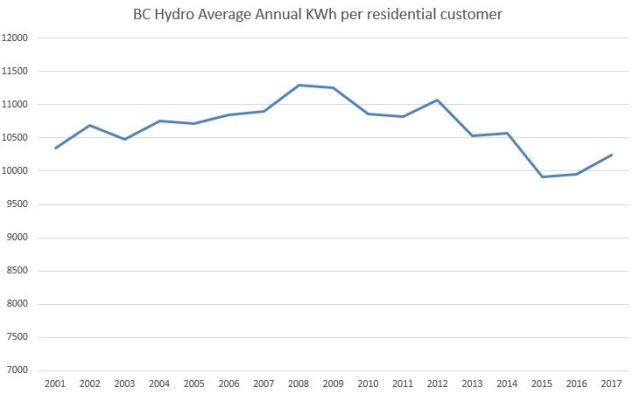
Looking at the data we can see that population is growing steadily while per customer demand decreased for a while but appears to have bottomed out. This might not sound like much but this is a big accomplishment. A household in 2017 has far more electrical gadgets than a similar household in 2000. Thanks to programs like PowerSmart, and Energy Star we have been saving energy on lighting and large appliances but thanks to the folks at Apple, Nintendo, Sony and Samsung we are using more electricity on phones, computers, large-screen televisions and gaming units. Ultimately, the whole thing has been a wash. If the bottoming out of the efficiency curve continues then residential demand will be expected to increase pretty much in lock-step with population.
So the question must be asked, why has overall demand appeared steady during the recovery and what does this mean for future demand? Well to answer that question we have to look at the breakdown of who is using the electricity in BC:
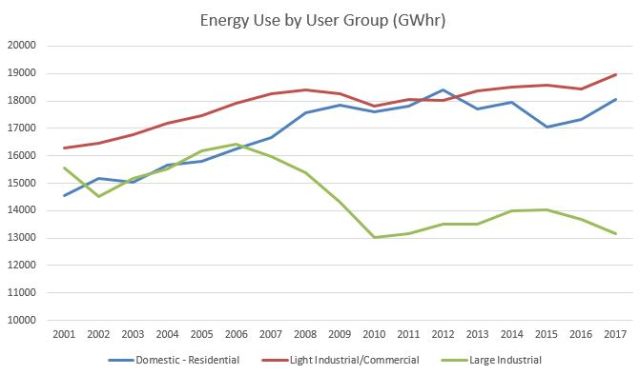
As the graph shows the Light Industrial/Commercial and Residential sectors have shown steady growth which has been masked by the steady decline in Large Industrial users. As discussed Light Industrial/Commercial demand seems to reflect the overall economy. It increases with in a growing economy, it decreases in a recession and is stagnant in a stagnant economy.
The interesting thing is the divergence of Large Industrial and Residential use. In 2000-2001 Large Industrial users represented 34% of the BC Hydro’s domestic sales (corrected to exclude exports). The proportion dropped to 26% in 2016-2017. Residential users represented 31% of domestic sales in 2000-2001 and 36% 2016-2017. Residential demand is replacing Large Industrial demand to become a dominant driver in energy demand in BC. This trend can only increase as communities like the City of Vancouver move off natural gas and onto electricity for heating, cooking and hot water. What this graph makes clear is absent a huge jump in the mining/forestry sectors, the driving force in our future energy demand is going to be based on our population statistics; and that any Large Industrial development will be on top of the population-based demand increases.
Having looked at all the data let’s return to the topic of this post: future demand for use in policy discussions. Well the first thing this data-dive demonstrates is that you can make a number of arguments depending on what data you choose to include and which start date you choose for your analysis. Reading Mr. Harcourt’s submission the date range chosen becomes very interesting. While using a 10-year interval sounds pretty reasonable, in light of what we know about the last 10 years it becomes very problematic. By choosing 10 years Mr. Harcourt places his start date at the height of the market before the 2008 crash. Comparing only 2008 to 2017 shows a relatively steady energy demand picture but it does so by ignoring the effects of the crash and the post-crash recovery. Also by looking only at total demand the decline in Large Industrial masks the steady increase in Residential demand caused by our steadily increasing population. Moreover, the recovery of our economy, that has been evidenced particularly in the last 6 months or so, indicates likely continued growth in the Light Industrial/Commercial demand.
Anyone familiar with demographic trends in BC would look at the data above and conclude that electricity demand is going to go up in the near future. A re-building economy driving up Light Industrial/Commercial demand and population increases driving up Residential demand can only mean increasing overall demand. This pretty much shreds Mr. Harcourt and Mr. Eliesen’s arguments. The flat demand discussed in the various other submissions simply represents strategic (or unfortunate) use of the historical data. As the mutual fund people always say “past performance should not be viewed as an indicator of future results”.
The data set looked at in its entirety, and in combination with the economic and demographic projections for BC, makes it clear that demand for electricity in BC is going to go up. Moreover, as I have pointed out many times (including in my BCUC Submission) the alternatives to Site C are all either more expensive (solar, wind and geothermal), speculative (i.e. dependent on technologies not currently available), or non-existent (i.e. cheap imports from outside BC). There is a reason I have reluctantly thrown my support behind the Site C project. Because I recognize that as bad as the project may be, in my opinion it is undoubtedly better than what we will see absent Site C.
Author’s Note:
I would be remiss if I didn’t point out that my submission to the BCUC actually I addresses (and in my personal opinion shreds) Mr Eliesen’s argument about “inventing customers” in Alberta and “inventing international demand”. As my submission details, those markets will clearly exist based on Alberta’s, Washington’s and California’s various efforts to fight climate change.

The big users of heavy industrial power relevant to your economy are usually smelters or pulp and paper mills. They are very sensitive to energy costs, and will move or shutdown if the price goes up. Witness the aluminium smelters shutting down in Australia, even though the bauxite comes from there. The other thing they may do, is embed on-site generation. For mills, this can often be by a waste materials boiler and backpressure turbine.
The graph shows the drop seemed to happen 2006-10 and totalled about 4000GWh (500MW baseload). That indicates it was a number of industries involved and a gradual process, some predating the recession. Did this happen?
LikeLike
Good points Chrism56….Heavy industry has always had a different (lower) electricity rate from residential users. With every increasing rates, which are now inevitable, industry may simply pack up and leave. Also, selling Site C power to California is not necessarily an easy option. California has indicated that Site C power is NOT green. Also, California sits on a 22% surplus, as we here in BC have closer toa 30% surplus.
LikeLike
As a member of the Sign-off team, in 1984 for Site C, Confidential associate to Mr. F. Sampson, Chief Senior Engineer on this project, I can honestly say that Harry Swain has the facts close to what was reported in 1979-1984. $Millions were wasted then, that have not been taken into the full financial picture.
The 3 Senior Engineers, that started this review, kept telling B. C. Hydro Board of Directors (Laxton CEO), to stop wasting Money and Time on this Site C. Their arrogance at the time, was extremely burdensome to all of the Engineering staff! They refused to accept Engineering facts and were more interested in wasting money. – that lined their friends pockets.
All the numbers correspond to those predictions and to the current numbers – given the equivalent cost today.
There was never a Feasibility for Site C then, and more so NOW.
The MEDIA has not revealed, that in 1984, the 300 M. drilling Projects found Site C sub-surface stability could not support the weight of any Dam Design.
For 50 Meters below the river bed, is Silt/Clay composite – and then much more Sandstone below that. I should know because I sent the bags of depth labelled Silt/Clay to the Labs for testing, after the reviews done by Mr. F. Sampson.
The Public have been denied the truth about what is fully being produced NOW, as even revealed facts are not even up-to-date on Wikipedia: https://en.wikipedia.org/wiki/List_of_generating_stations_in_British_Columbia
B. C. Hydro has a HUGE surplus of power, which is being sold far cheaper that costs to B. C. customers.
It is time to Shut Down This White Elephant, that will only make the Wealthy Investors VERY RICH!
THE SOURCES IN ‘A CHEMIST IN LANGLEY’, ARE FROM BC GOVERNMENT – KNOWN WELL TO BE FALSE/PADDED! There is no credibility to the SOURCE!
LikeLike
Your story doesn’t make sense, Farley. Whatever you think you knew 33 years ago is irrelevant in the upcoming age of the electric car where we can see that we would need several more site C size dams just to charge their batteries….
LikeLike
Blair, where have you gone ? We need your dose of intelligent commentary more often.
LikeLike
Pingback: Reviewing Anti-Site C demand estimates | A Chemist in Langley
If geotech info is true that subsurface stability cannot support weight of designed dam then that fact alone is fatal to any pro site argument, rendering debates about demand irrelevant. Some relevant questions are : what is the cost to improve subsurface stability; secondly, how safe are those engineering measures, an thirdly what types of engineering uncertainties have been identified and what are risks associated with them. The big one is, what engineering uncertainties, including system wide uncertainties are we unaware of?
Regarding rising demand in the light commercial- industrial sector and residential sector, how much of that is elastic demand, how much requires firm power and why not shift costs to those sectors to meet their own demand, supplying some state subsidies – thereby moving to a more distributed power network as California is doing.
LikeLike